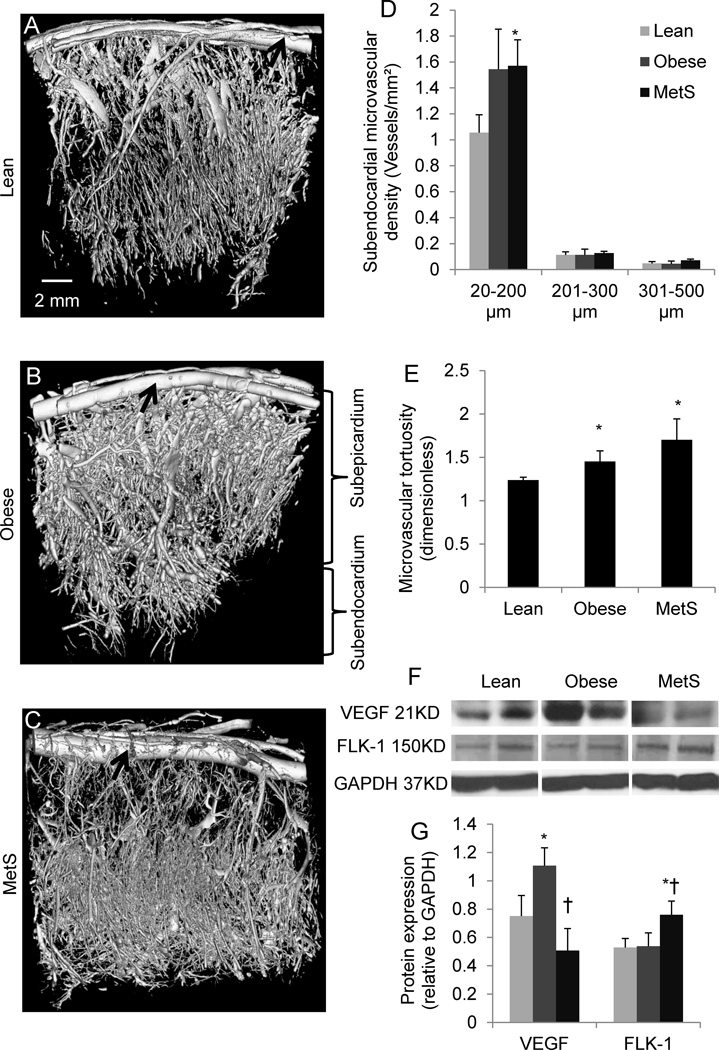
Figure 2.
Representative three-dimensional tomographic images of the myocardial microcirculation (A–C), subendocardial microvascular density quantification (D), and tortuosity (E); myocardial protein expression of vascular-endothelial growth-factor (VEGF) and its receptor FLK-1 (F), and their quantifications (G). *p≤0.05 vs. lean, †p≤0.05 vs. obese. Black arrows indicate epicardial arteries. N=5 for Western-blot.

