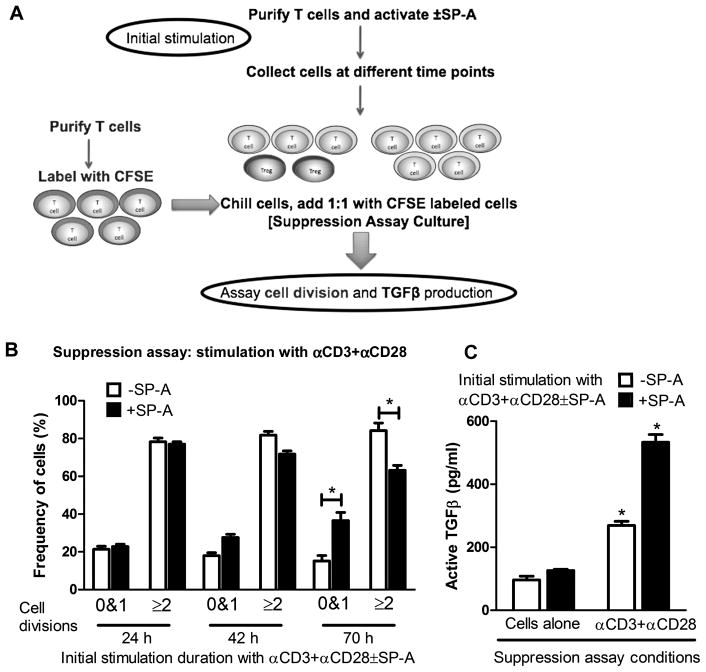
Figure 4. SP-A enhances the frequency of Foxp3+Tregs in responder T cell populations.
Purified T cells were activated with anti-CD3 and anti-CD28 in the absence or presence of SP-A as shown in the flowchart (A). Cells were harvested, washed and chilled at 24 h, 42 h and 68–70 h post initial activation time points. These cells were used 1:1 in a suppression assay with freshly isolated T cells pulsed with CFSE. In the suppression assay (B), cells were left unactivated as a control or activated with anti-CD3+anti-CD28 for a total of ~70 h, and percentages of divided cells were determined by flow cytometry. Results obtained from cells activated for 24 h, 42 h and 65 h are depicted as the proportion of cells that have either remained undivided or have undergone 2 or more divisions. (C) shows the TGFβ levels from culture supernatants obtained from the cultured cells in the suppression assay, as determined by a functional bioassay using CCL64MLE cells. This data is representative of three independent experiments.*p<0.05.

