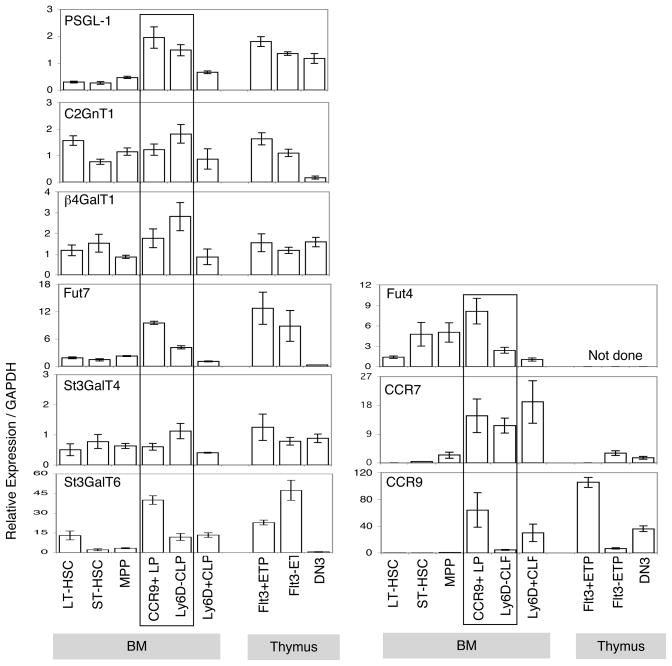
Figure 5. Glycosyltransferase enzyme gene expression profile in BM and early thymic progenitors.
Quantitative PCR analysis of total cellular RNA from indicated cell fractions purified from Gr-1, CD19, Mac-1 depleted BM and CD4, CD8 depleted thymus of C57BL/6 WT mice. We identified LT-HSC as CD150+CD34− and ST-HSC as CD150−CD34+ cells among LSK BM progenitors. MPP were LSKFlt3lo, CCR9+LP were LSKFlt3hiCCR9hi, Ly6D−CLP were Lin−Sca1loKitloFlt3hiIL7Rα+Ly6D− and Ly6D+CLP were Lin−Sca1loKitloFlt3hiIL7Rα+ Ly6D+ cells in BM. To isolate thymic progenitors, we identified Flt3+ETP as Lin−Kit+CD25−Flt3+, Flt3−ETP as Lin−Kit+CD25−Flt3−, and DN3 as Lin−KitloCD25+ cells in thymus. Transcript levels of indicated genes were normalized to GAPDH mRNA levels and are indicated in arbitrary units. Means and standard errors of the results obtained from 3 independent measurements are shown.

