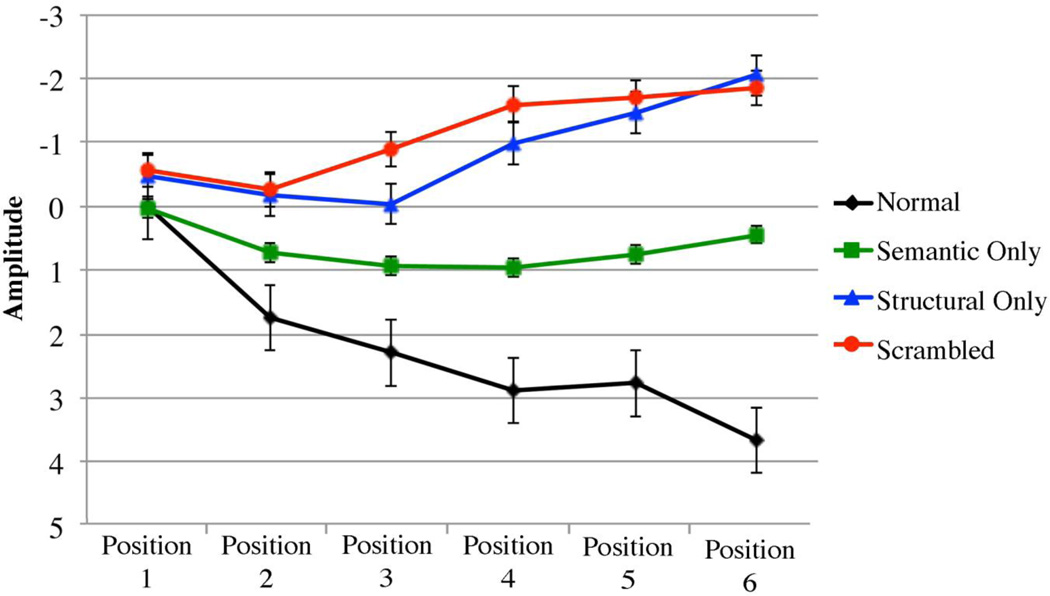
Figure 9.
Amplitudes of voltages evoked by panels in each sequence type at each sequence position are shown for the N400 (400–600ms) collapsed across the frontal, centro-frontal, and central-temporal electrode regions (as with ERP data, positive is plotted down). Error bars represent standard error.

