
Figure 1. Characterization of NK cell markers in a mouse model of COPD.
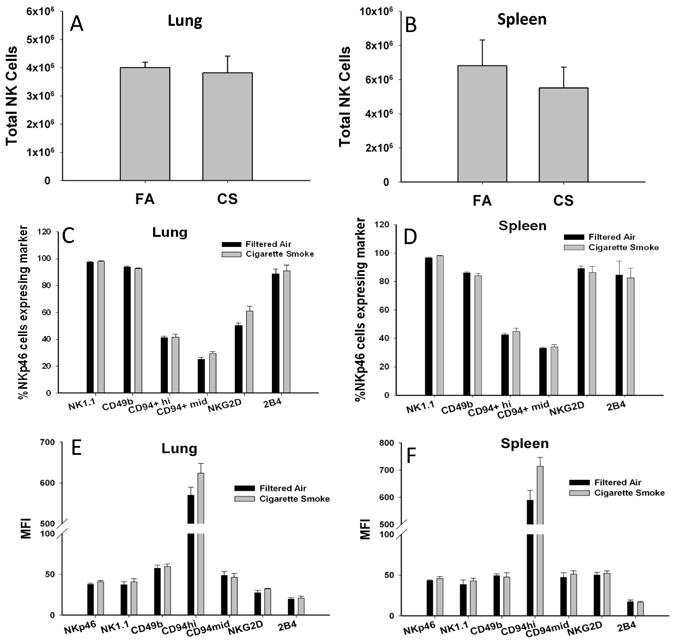
NK cells were isolated from C57BL/6 mice exposed to FA or CS for 6 months and analyzed by flow cytometry. (A-B) Total NK cells enumerated by NKp46+ expression. (C-D) The percentage of NKp46+ cells expressing the indicated NK cell markers. (E-F) The geometric mean fluorescent intensity (MFI) of NK cell receptors. Values are presented as means ± SEM. n = 5-6 per group. All data representative of two independent experiments.