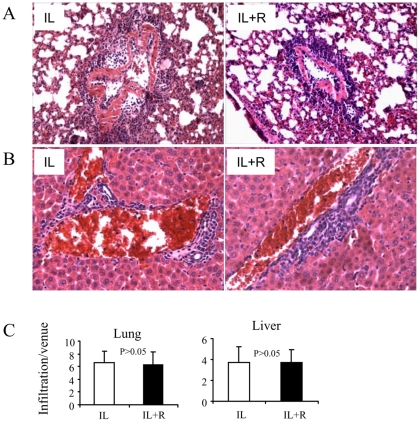
Figure 4. Histological studies of the lung and the liver for inflammatory cell infiltration.
Lungs and livers from VLS mice were harvested and preserved in 10% formalin solution. Sections were stained with hematoxylin and eosin. The level of perivascular infiltration was determined by counting the number of cells infiltrating around a venule. The data depicts the mean ±SEM of sections from four individual mice. A. The level of perivascular infiltration in lungs. B. The level of perivascular infiltration in livers. C. Statistic analysis of the infiltration depicts p>0.05 between IL-2 and IL-2+Resveratrol groups. Original magnification, ×200.

