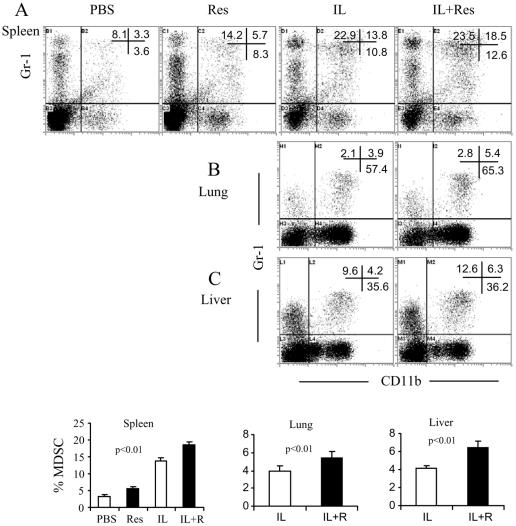
Figure 7. Expansion of MDSC by IL-2 and/or resveratrol treatment.
Splenocytes and the infiltrating cells were stained with FITC-conjugated anti-CD11b and PE-conjugated anti-Gr-1 mAbs. The stained cells were analyzed by flow cytometry. The representative dot plots from spleen (A), lung (B), and liver (C) and the statistical analysis of the percentage mean ±SEM of MDSC (D) were shown.

