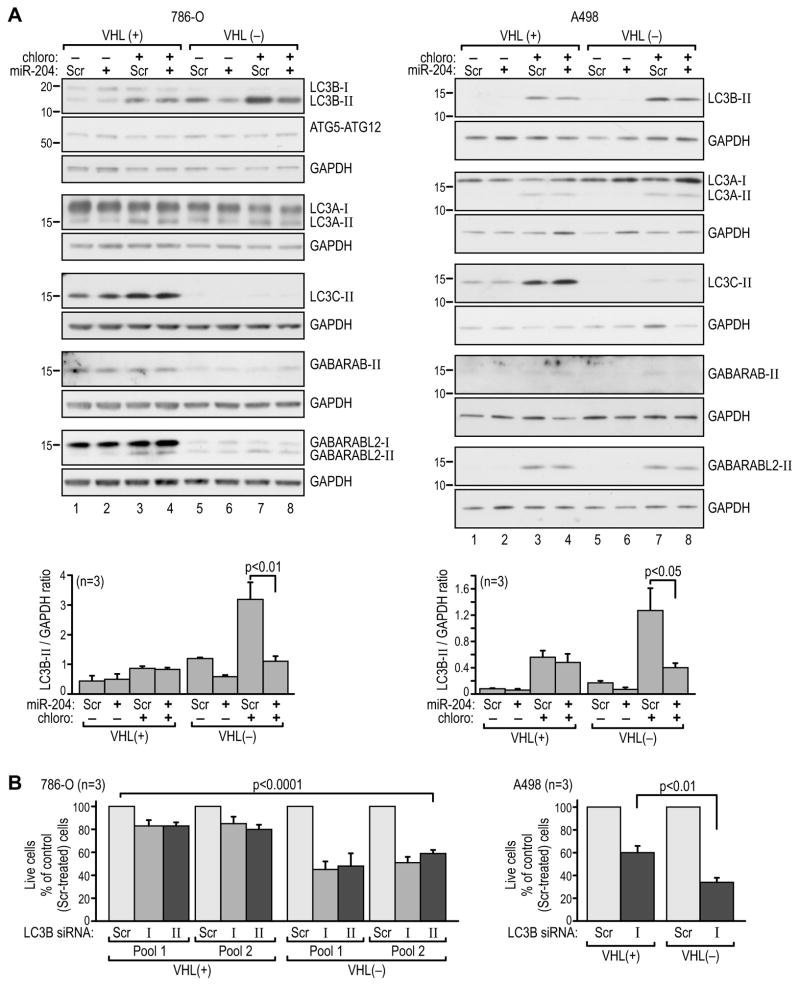
Figure 5. MiR-204 specifically represses accumulation of LC3B-II in the flux experiment.
(A) Western blot analysis of LC3 orthologs in extracts from 786-O and A498 cells grown in 0.1% serum conditions. The experiment follows the same treatment sequence as shown in Figure 3A, with 100 μM chloroquine applied 24 hr after treatment with short pre-miR-204 or scramble control. The cells were collected after 1.5 hr in the case of 786-O cells and after 3 hr in the case of A498 cells, when saturating effects of chloroquine were observed based on the time-course experiments. This was approximately 24 hr before cell death was observed as shown in Figure 3B. Quantification of 3 independent experiments is shown at the bottom.
(B) Percentage of live cells measured using trypan blue analysis in 786-O and A498 VHL(+) and VHL(−) cells transfected with LC3B siRNA, where 100% corresponds to live cells counted after transfection with scramble control construct. Time line as shown in Fig. S4A. See also Figure S5.

