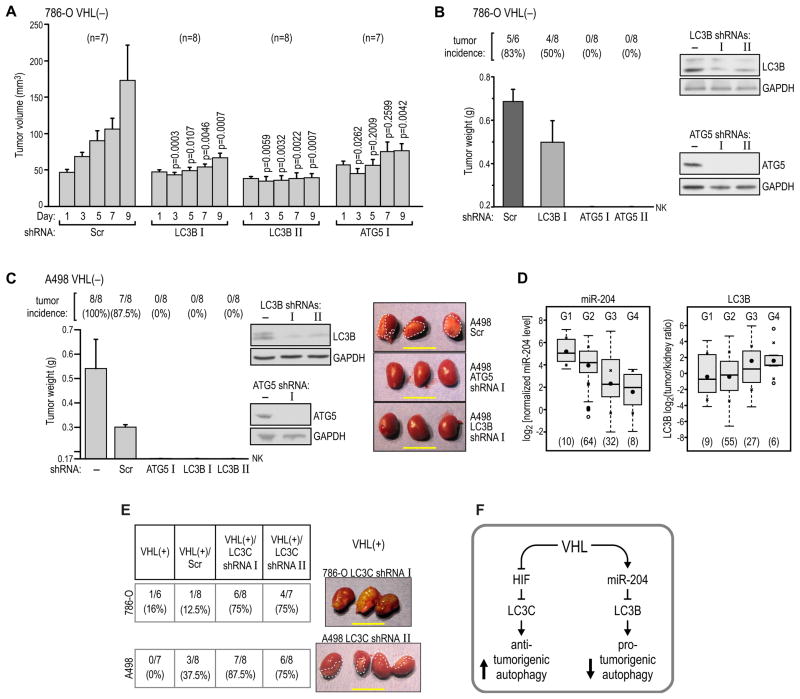
Figure 8. LC3B-dependent macroautophagy is necessary for RCC tumor growth.
(A) Growth of tumors formed by 786-O VHL(−) cells in subcutaneous xenografts injected with packaged lentiviruses containing two different shRNAs against LC3B, or one against ATG5, as compared with the growth of control tumors injected with scramble sequence-containing virus. The number of mice in each experiment is shown in parentheses above the graph.
(B) Growth of tumors formed by pools of 786-O VHL(−) cells stably transfected with two different shRNAs against ATG5 or one against LC3B, and injected under the kidney capsule in nude mice. Western blots show levels of protein knockdown in stable pools of cells under conditions of 10% serum starvation. Cells were plated and grown for 48 hr in medium containing 10% serum before injection.
(C) Growth of tumors formed by pools of A498 VHL(−) cells stably transfected with two different shRNAs against LC3B and one against ATG5 and injected under the kidney capsule in nude mice. Western blots show levels of protein knockdown in stable pools of cells. Cells were treated as in panel B. Photographs of representative tumors are shown with dashed lines drawn to help visualize the tumors.
(D) There is a significant decrease in the level of miR-204 (p<0.001) and a significant increase in the level of LC3B (p<0.05) correlating with tumor grade in human ccRCC tumors. Because of the small number of tumors classified as Grades 1 and 4, the statistical comparison was made between combined subpopulations of G1+G2 vs. G3+G4 tumors. The number of tumors of each grade is provided in parentheses at the bottom. Statistics were calculated as in Figure 1B. Means ± SD are shown.
(E) Formation of tumors in orthotopic xenografts by VHL(+) 786-O and A498 with stable knockdowns of LC3C using two different LC3C shRNAs in each cell line. The table lists numbers of mice analyzed and photographs of representative tumors are shown. Dashed lines help visualize tumorigenic infiltrate of A498 cells. All scale bars = 1 cm.
(F) Schematic representation of the role of VHL in the regulation of autophagy in RCC tumor growth. See also Figure S8.

