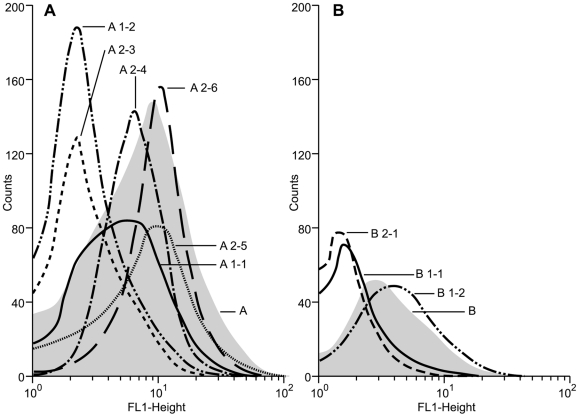
Figure 2. FACS analysis of EGFP expression in original and rederived cell lines.
Green fluorescence generated by the transgenic bovine cells was determined using the FL1 emission channel. The relative numbers of viable cells was plotted as a function of variable intensities of green fluorescence from individual cells. (a) the original cell line A and all its rejuvenated derivatives and (b) cell line B and the cell lines that were rederived from it.

