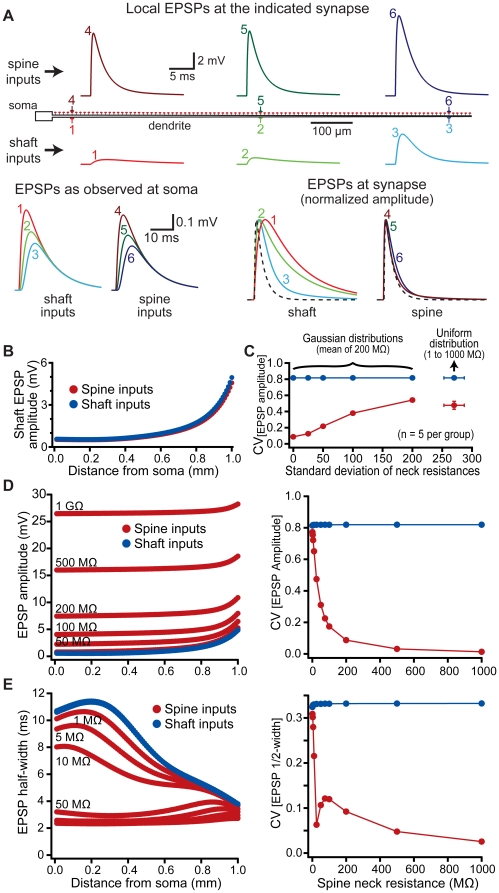
Figure 2. Spines reduce location-dependent variability of EPSP properties.
A) Top, diagram of a “ball-and-stick" model neuron. Synapses were placed onto the dendritic shaft or onto spines (200 MΩ spine neck resistance) at the locations indicated (synapses 1 to 6). Local EPSPs generated in the dendritic shaft (synapses 1 to 3, lower traces) or in spines (synapses 4 to 6, upper traces) are color-coded by location. Bottom left, somatic EPSPs resulting from inputs to the shaft (1 to 3) and spines (4 to 6). Bottom right, local shaft (1 to 3) and spine (4 to 6) EPSPs normalized and superimposed to allow comparison of EPSP kinetics. The time course of the underlying synaptic conductance is indicated by a dashed line. B) Plots of EPSP amplitudes for spine (red) and shaft (blue) inputs as measured in the dendritic shaft. C) Plot of the coefficients of variation (CVs) (mean ± standard deviation) for spine (red) and shaft (blue) EPSP amplitudes for inputs having variable spine neck resistances determined from Gaussian or uniform distributions, as indicated (n = 5 trials per group). D, E) Left, plots of local EPSP amplitude (D) and EPSP half-width (E) versus distance from the soma for inputs onto the dendritic shaft (blue) and spines (red) with the indicated spine neck resistances. Right, plots of the coefficient of variation (CV) for EPSP amplitude (D) and half-width (E) versus spine neck resistance.

