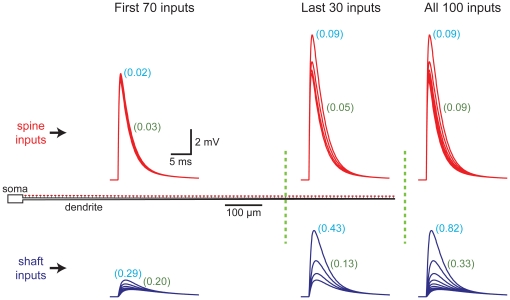
Figure 3. Spine-dependent reduction of EPSP variability does not depend on dendritic location.
Comparisons of the CVs for EPSP properties calculated over the entire dendritic population, or for inputs restricted to the first 700 µm (70% of inputs) or last 300 µm (30% of inputs) of the dendrite. Left, local EPSPs at spine (red traces) or shaft (blue traces) inputs along the first 700 µm (∼100 µm intervals). Middle, local spine and shaft EPSPs generated along the last 300 µm of dendrite. Right, local EPSPs along the entire dendrite. CVs for EPSP amplitude (indicted in light blue) and half-width (indicated in green) were calculated for all inputs located within the dendritic subregions (n = 70, 30, and 100, respectively, for first 70%, last 30%, and entire synapse population).

