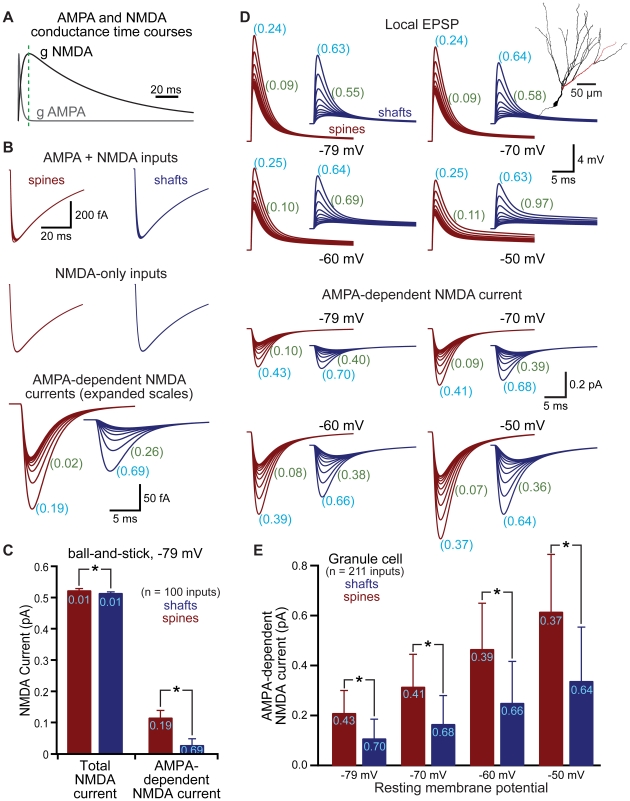
Figure 6. Spines enhance and standardize AMPA-dependent NMDA currents.
A) Time courses of AMPA and NMDA receptor-mediated conductances. Green dashed line indicates the peak of the slower NMDA conductance. B) NMDA currents generated in a ball-and-stick model neuron when both AMPA and NMDA conductances are activated (top) or when the NMDA conductance is activated alone (middle). Subtraction allows isolation of the AMPA-dependent NMDA current (bottom). Traces show responses at ∼100 µm intervals. C) Comparison of total NMDA current (left) and AMPA-dependent NMDA current (right) in spines (red) and shafts (blue) for the ball-and-stick neuron resting at −79 mV. CVs shown in light blue. D) Local (spine or shaft) EPSPs (top traces) and AMPA-dependent NMDA currents (lower traces) simulated in a dentate granule neuron (inset). Traces show responses at inputs occurring at ∼20 µm intervals along the dendrite indicated in red in the inset morphology. CVs for EPSP or AMPA-dependent NMDA current amplitudes (light blue) or half-widths (green) shown for all 211 inputs (∼10 µm intervals) throughout the granule cell dendritic tree. E) Comparison of AMPA-dependent NMDA current amplitudes for inputs onto spines (red) and shafts (blue) in a dentate granule cell at the indicated resting membrane potentials. CVs shown in light blue. Data shown as mean ± standard deviation. Asterisks indicate p<0.05.

