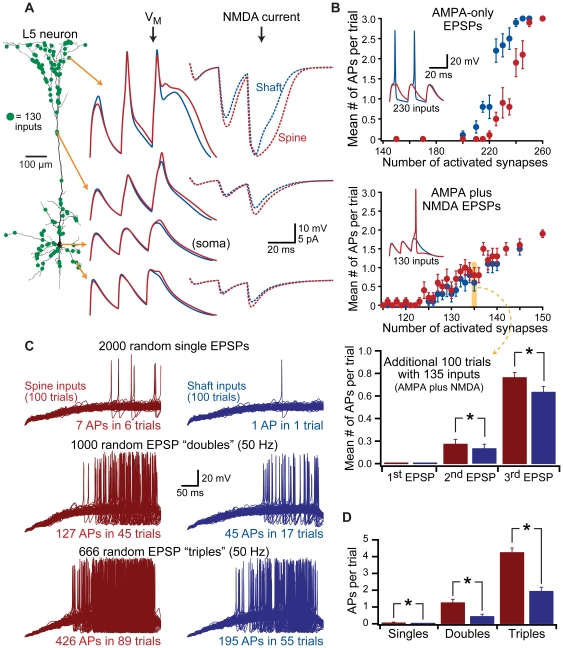
Figure 10. Spines enhance action potential generation.
A) Left, model layer 5 neuron with spine and shaft inputs located at ∼2 µm intervals along dendrites. Green dots indicate the locations of 130 randomly selected synaptic inputs. Middle, responses to trains of 3 AMPA+NMDA EPSPs (50 Hz) delivered simultaneously to spines (red) or shafts (blue), and recorded at the indicated somatic and dendritic locations. Right, NMDA currents for the indicate synapses (dotted lines). B) Plots of the number of action potentials generated per trial vs number of coactivated synapses for AMPA-only inputs (top) and AMPA+NMDA inputs (middle). Ten trials per synapse number. Data shown as mean ± SEM. Insets show example somatic recordings from 230 AMPA-only inputs (top) or 130 AMPA+NMDA inputs (middle; different set of 130 inputs than shown in A). Lower graph shows the mean number of action potentials occurring in an additional 100 trials having 135 random AMPA+NMDA inputs. C) Superimposed responses from 100 trials in which varying numbers of synapses were activated at random timings over 400 ms at spine (left) or corresponding shaft (right) locations in the model shown in A. Each pair of trials (spine and shaft) involved the same input locations and timings. Top traces show responses to 2000 inputs activated once within the 400 ms window (random timings). Middle traces show responses to 1000 inputs activated twice each with 20 ms intervals (total of 2000 synaptic activations). Bottom traces are responses to 666 inputs activated three times with 20 ms intervals (total of 1998 synaptic activations). D) Summary graph showing the number of action potentials generated per trial for the data shown in C.

