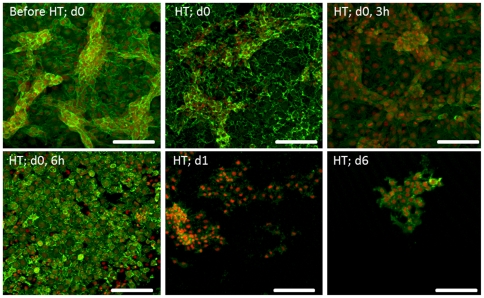
Figure 2. CLSM observation of B16-F10 melanoma cells submitted to a heat treatment (HT), 45°C for 30 min, stained for F-actin cytoskeleton (green) and nucleus (red).
Representative images (from four independent experiments) showing the effect of heat exposure on cell morphology and cell layer organization, at defined time-points (d 0, 0 h–d 6, immediately to 6 days after heat exposure). Bar represents 400 µm.

