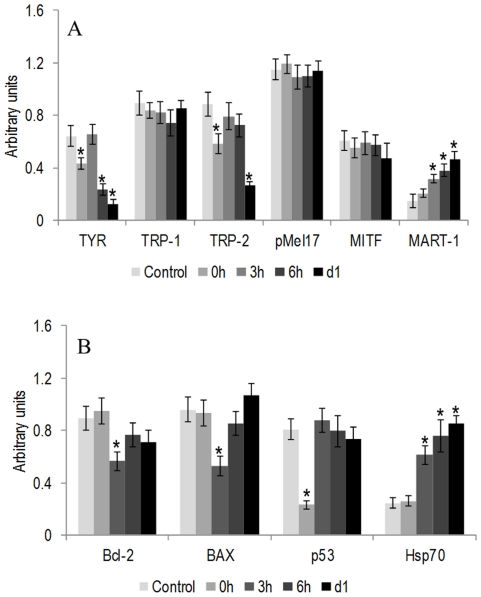
Figure 6. RT-PCR gene expression of B16-F10 melanoma cells submitted to a heat treatment (HT), 45°C for 30 min.
Expression of TYR, TRP-1, TRP-2, pMel17, MITF and MART-1(A) and Bcl-2, BAX, p53 and Hsp70 (B) during the first 24 h following the heat treatment. RT-PCR products were subjected to a densitometric analysis and were normalized to the corresponding β-actin value. *Significantly different from control (cultures kept at 37°C).

