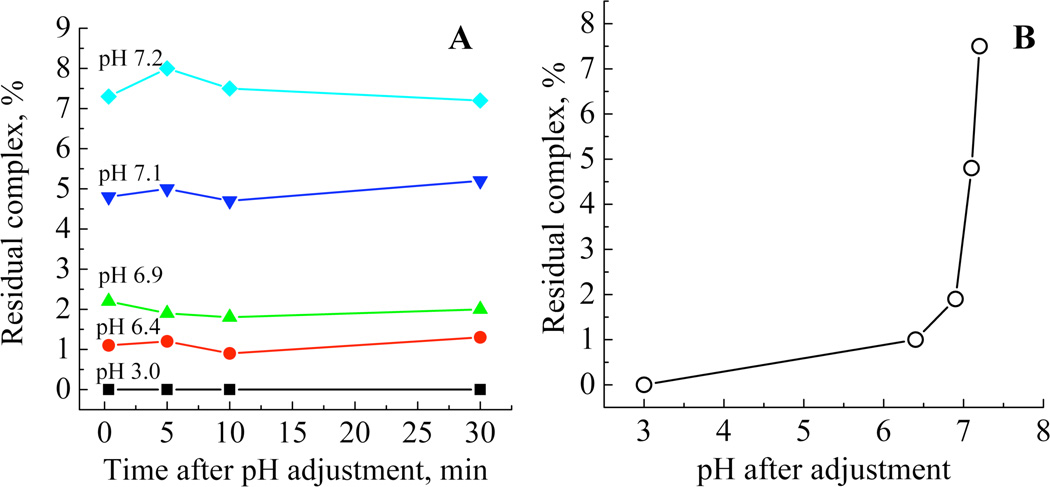
Figure 2.
(A) Plot of residual complex with dissociation time for samples treated with increasing amounts of acid. (B) Relationship between pH and residual complex concentration. The pH values 7.2, 7.1, 6.9, 6.4 and 3.0 correspond to molar equivalents of acid to complex of 1.4, 1.6, 1.8, 1.9 and 2.0:1 respectively.

