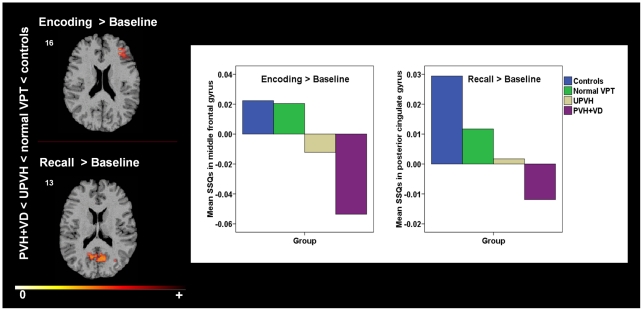
Figure 2. Between-group differences in regional brain activation during a verbal paired associates learning task.
Coloured areas signify PVH+VD < UPVH < normal VPT < controls. The numbers at the top of each row of slices represents the z coordinate in Talairach space. The right side of the brain corresponds to the right side of each slice. The graph shows cluster local maxima where differential activation across study groups was observed, as indicated by the mean of SSQ values.

