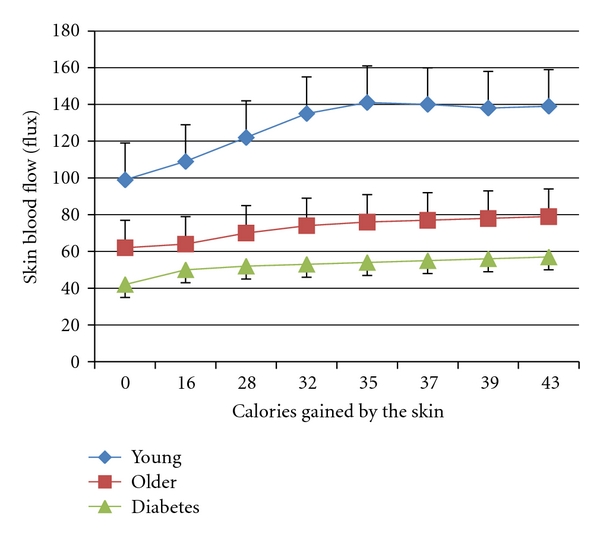
Figure 4.

Illustrating the relationship between skin blood flow and heat gained by the skin in young subjects, older subjects, and subjects with type 2 diabetes. Average ± the SD for each group is shown (n = 15). Experiments involved adding calories of heat to the skin by applying a brass 50 gram heated block at different temperatures and measuring the change in skin blood flow for a given caloric load [99, 100]. The difference in heat absorbance between the 3 groups was significant (ANOVA P < 0.05).
