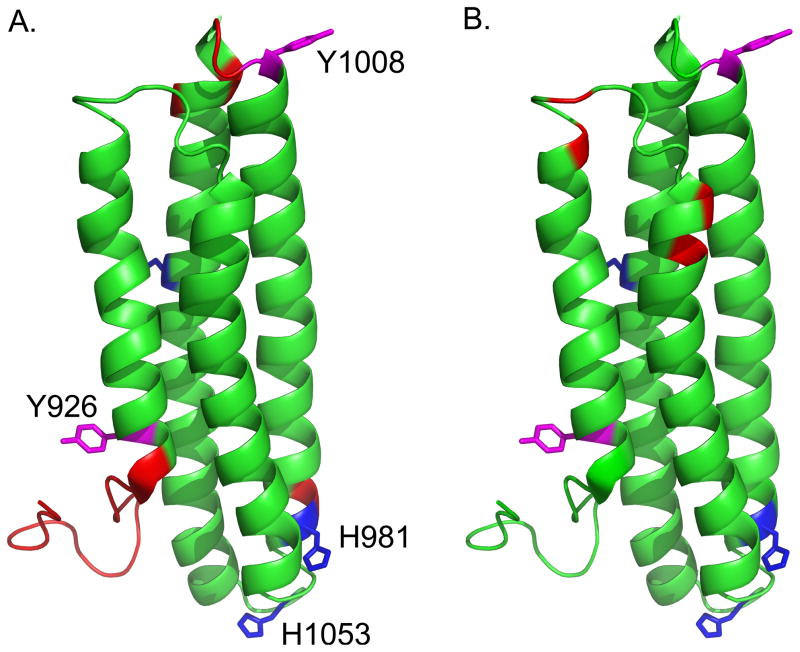
FIGURE 5.
pH-dependent changes in intensity derived from 1H-15N HSQC spectra. A. Peaks that broaden in the 15N-1H HSQC spectra from pH 5.5 to pH 7.5 are shown in red. These residues localize to the N and C-termini, the turn between helices 3 and 4 and the N-terminus of helix-4. B. Peaks that narrow from pH 5.5 to pH 7.5 are shown in red. These residues localize to the “hinge region” between helices 1 and 2. The two sites of phosphorylation, Y926 and Y1008, are shown in magenta, and the histidine residues are shown in blue.

