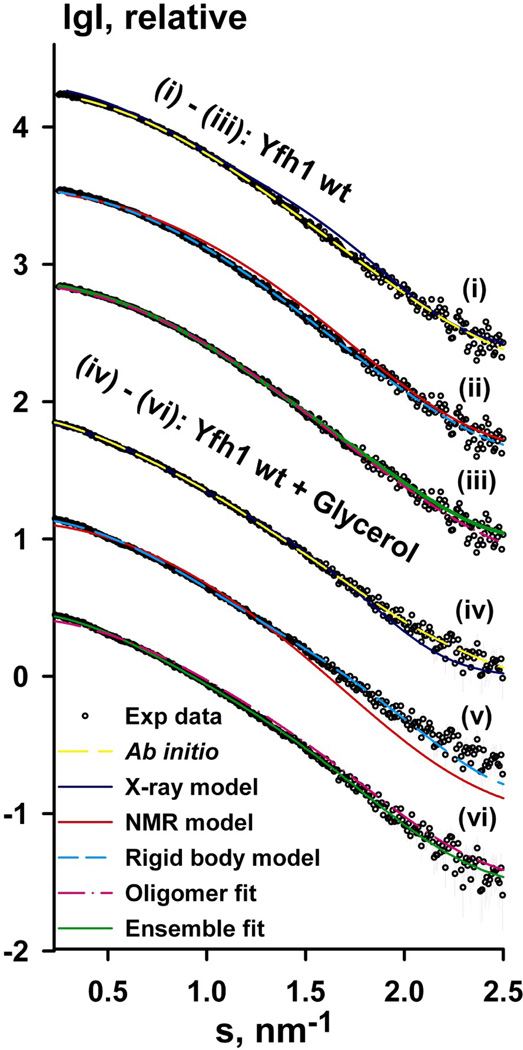
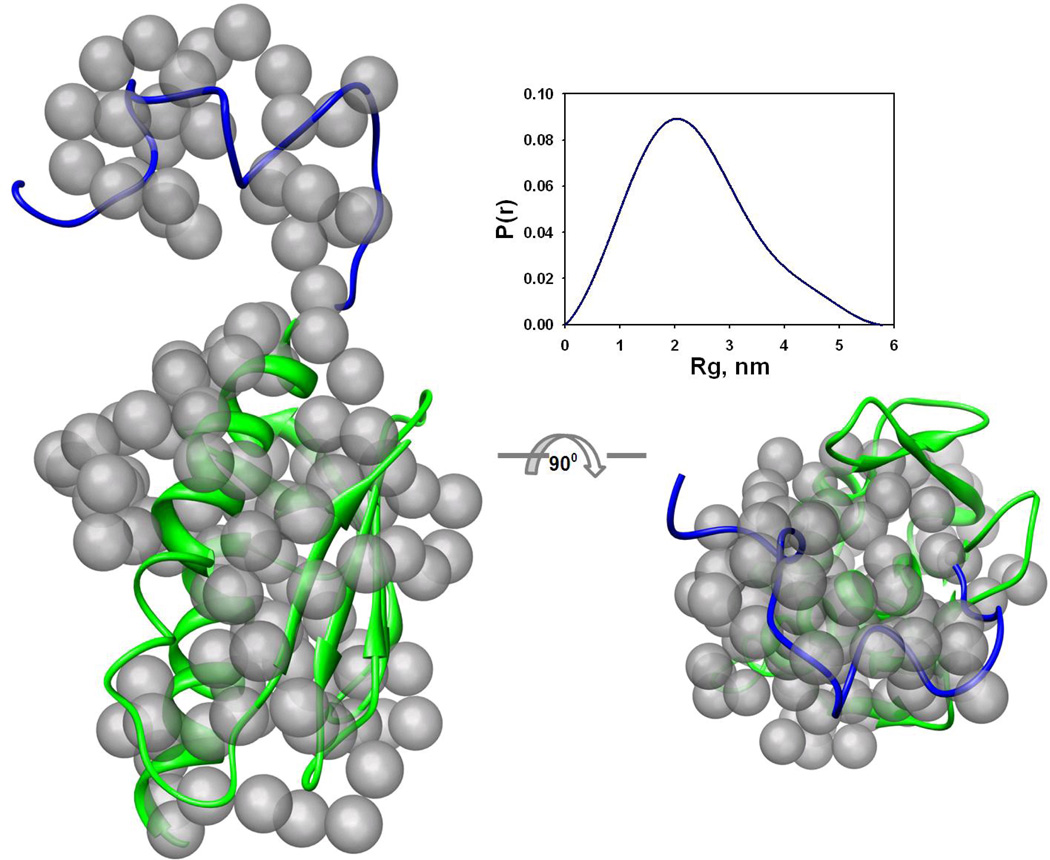
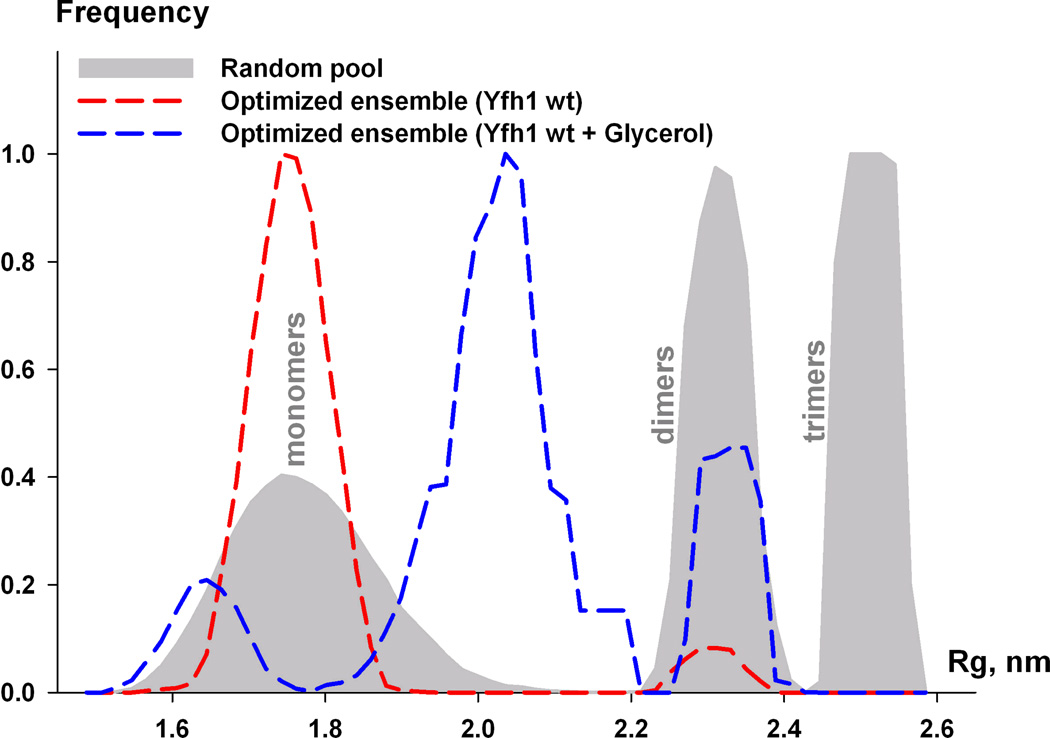
Figure 1. SAXS measurements of yeast frataxin.
(a) Experimental SAXS profiles (experimental data shown as black circles) for wild-type Yfh1wt (i–iii) and Yfh1wt + glycerol (iv–vi) were appropriately displaced along the logarithmic axis for better visualization and overlaid on the corresponding fits of the X-ray structure (i, iv), ab initio model (ii, v), lowest-energy NMR conformer (denoted NMR model on the figure, PDB ID: 2GA5), rigid body model from OLIGOMER (denoted oligomer fit) and the EOM ensemble (denoted Ensemble fit, iii, vi). Experimental SAXS data are shown to a maximal momentum transfer of s = 2.5 nm−1. See also Figure S1b for plots of the Guinier region.
(b) Superposition of the reference ab initio model on the rigid body model. Transparent gray beads represent the reference ab initio model generated by GASBOR. The view on the right has been rotated by 90° about the horizontal axis. The cartoon representation is used for the BUNCH model of frataxin (see text). The blue part corresponds to the modeled N-terminus, and green to the available high-resolution structure used for modeling. The figures were prepared using the CHIMERA molecular graphics system 70. The insert shows the distance distribution function p(r) used for ab initio modeling.
(c) Flexibility of frataxin in solution. Rg distribution for the random pool (6,000 models) containing equal fractions of monomers, dimers, and trimers is shown by the area filled with gray. Rg distribution of optimized ensemble corresponding to wild-type Yfh1 (red dashed line) and wild-type Yfh1 + glycerol (blue dashed line).


