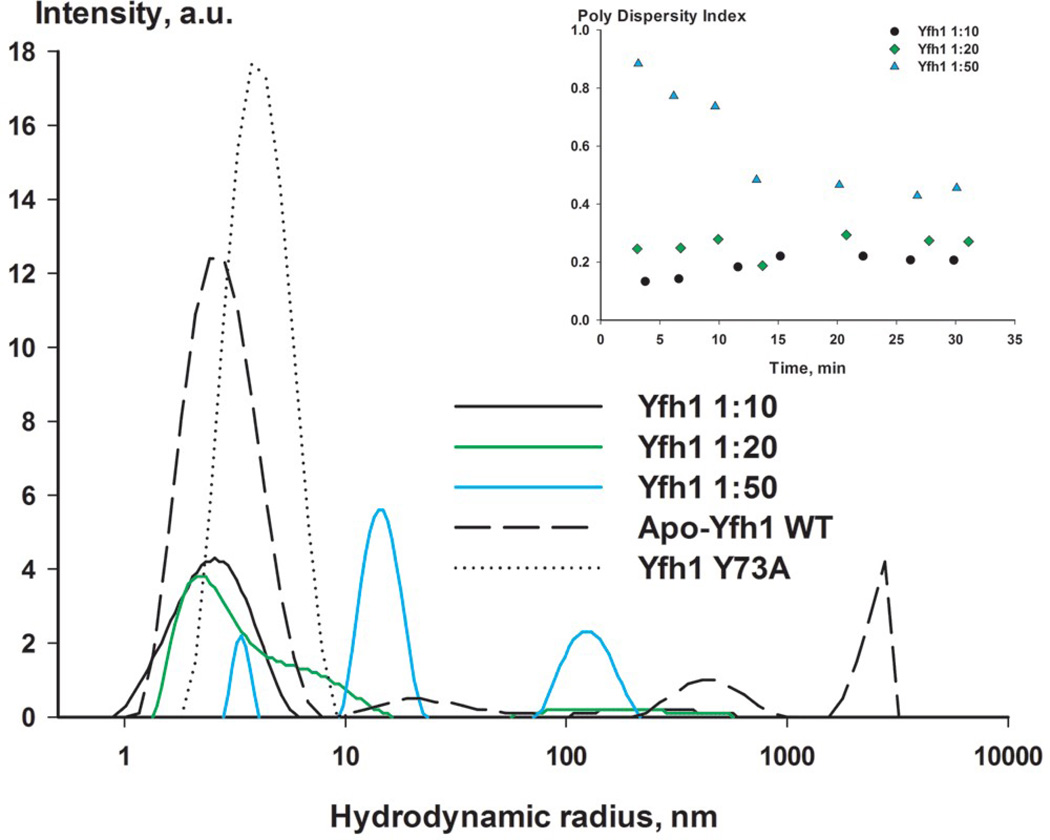
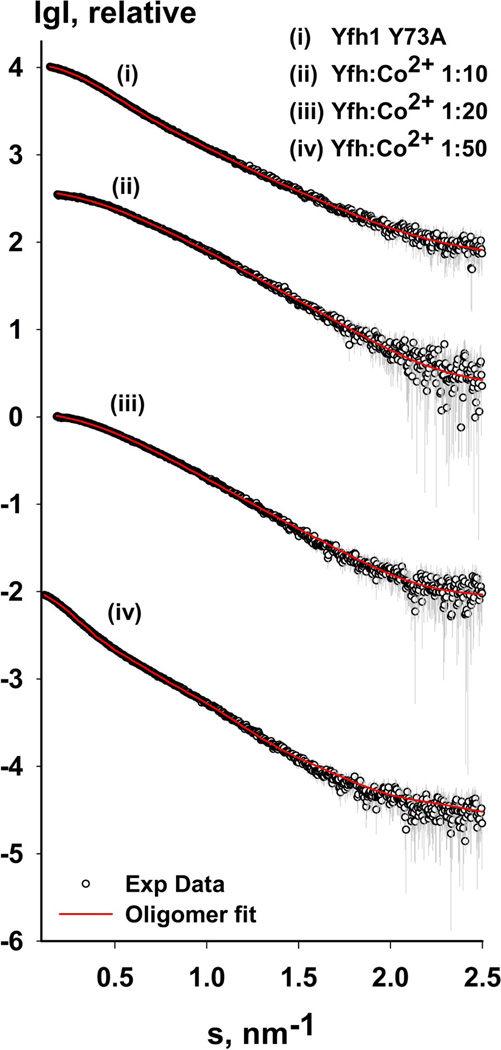
Figure 2.
Oligomerization of yeast frataxin homolog. (a) Sample size distribution (hydrodynamic radius) observed using DLS. Wild-type Yfh1 and the Y73A variant are shown in gray; Yfh1:CoCl2 ratios (1:10, 1:20, and 1:50) are shown in black, green, and blue, respectively. The insert shows the time-dependence of the polydispersity index after addition of CoCl2. (b) Experimental SAXS profiles (with experimental data shown as black circles) for the Y73A variant of Yfh1 and wild-type Yfh1 in the presence of different amounts of metal, as shown in the figure. The corresponding fit curve is overlaid on each profile (red) (see Table 3 for details). The data are shown to a maximum momentum transfer of s = 2.5 nm−1. See also Figure S1a for plots of the Guinier region.


