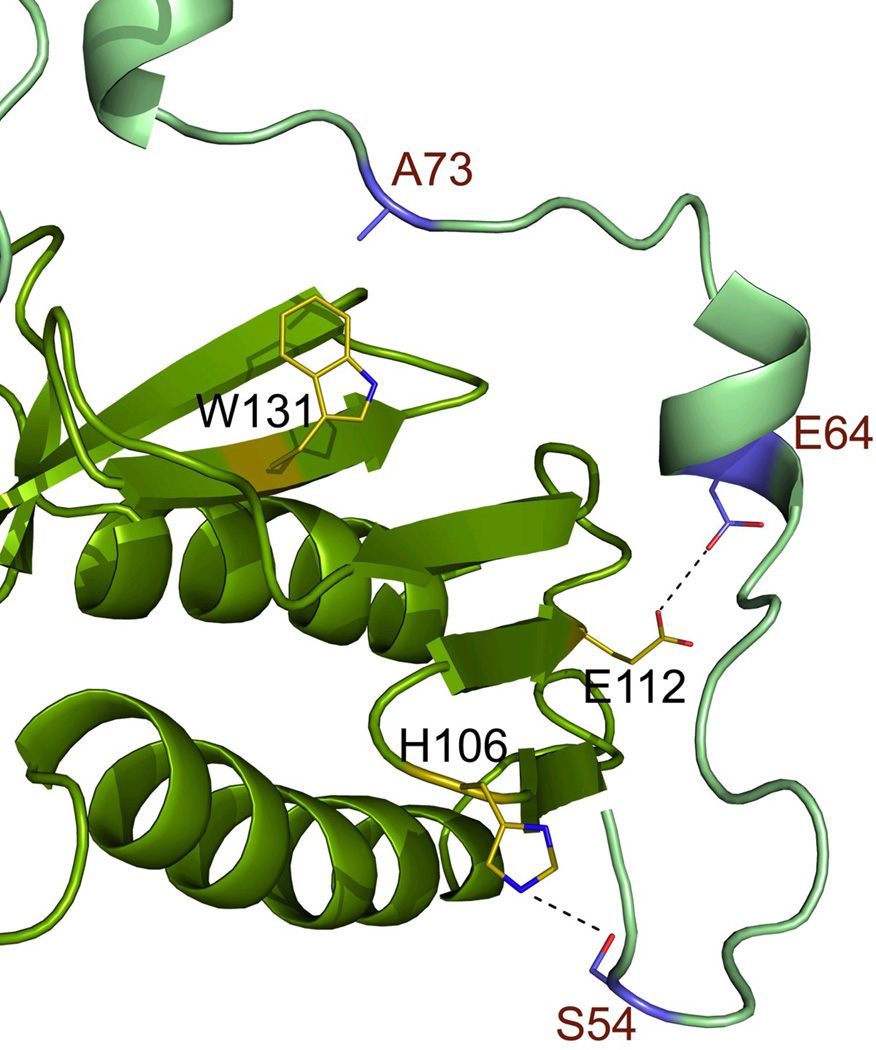
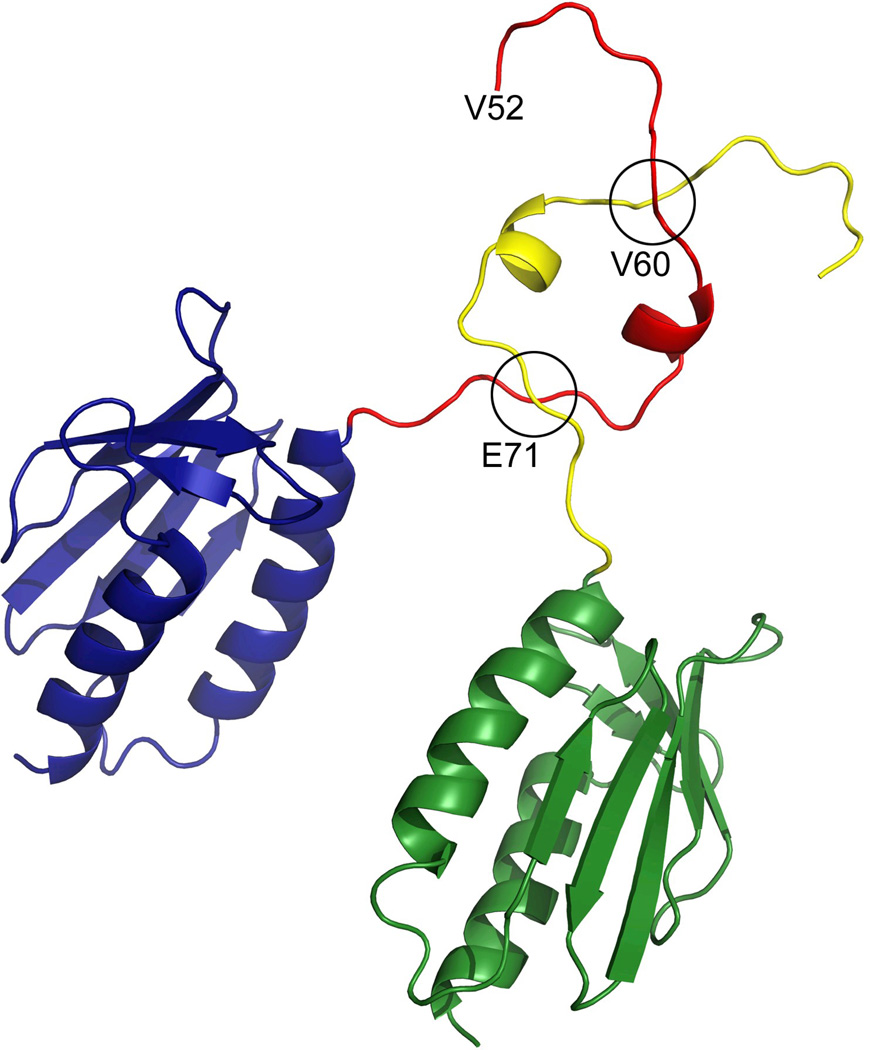
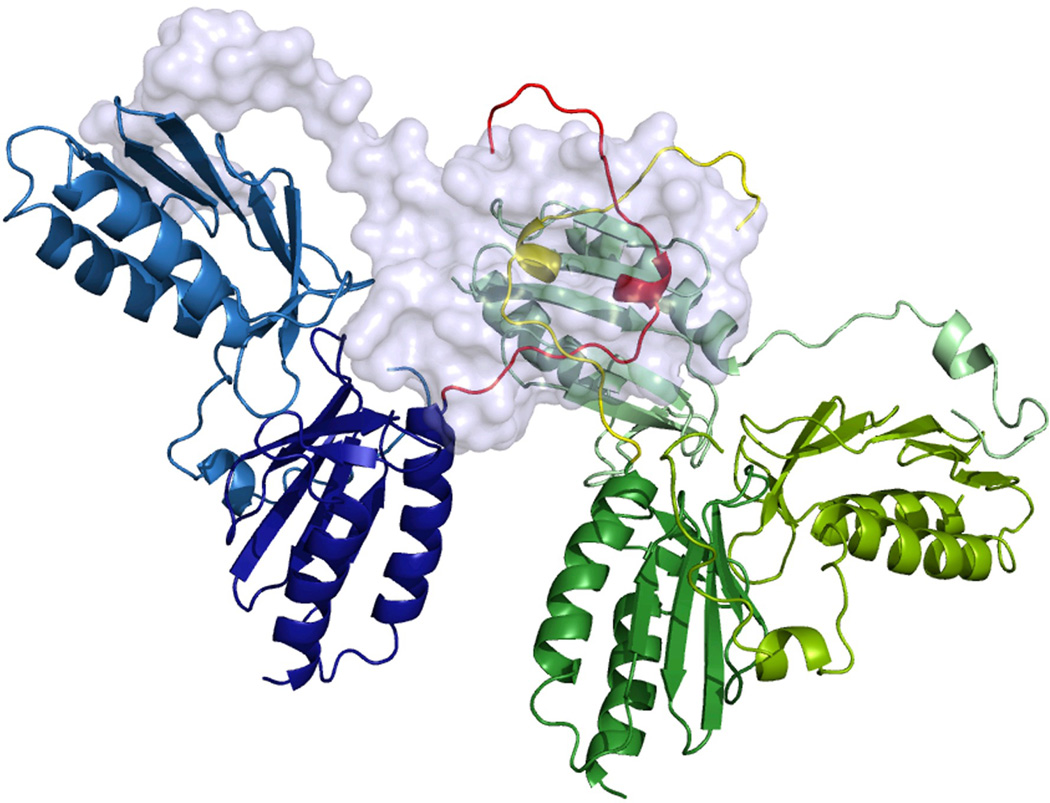
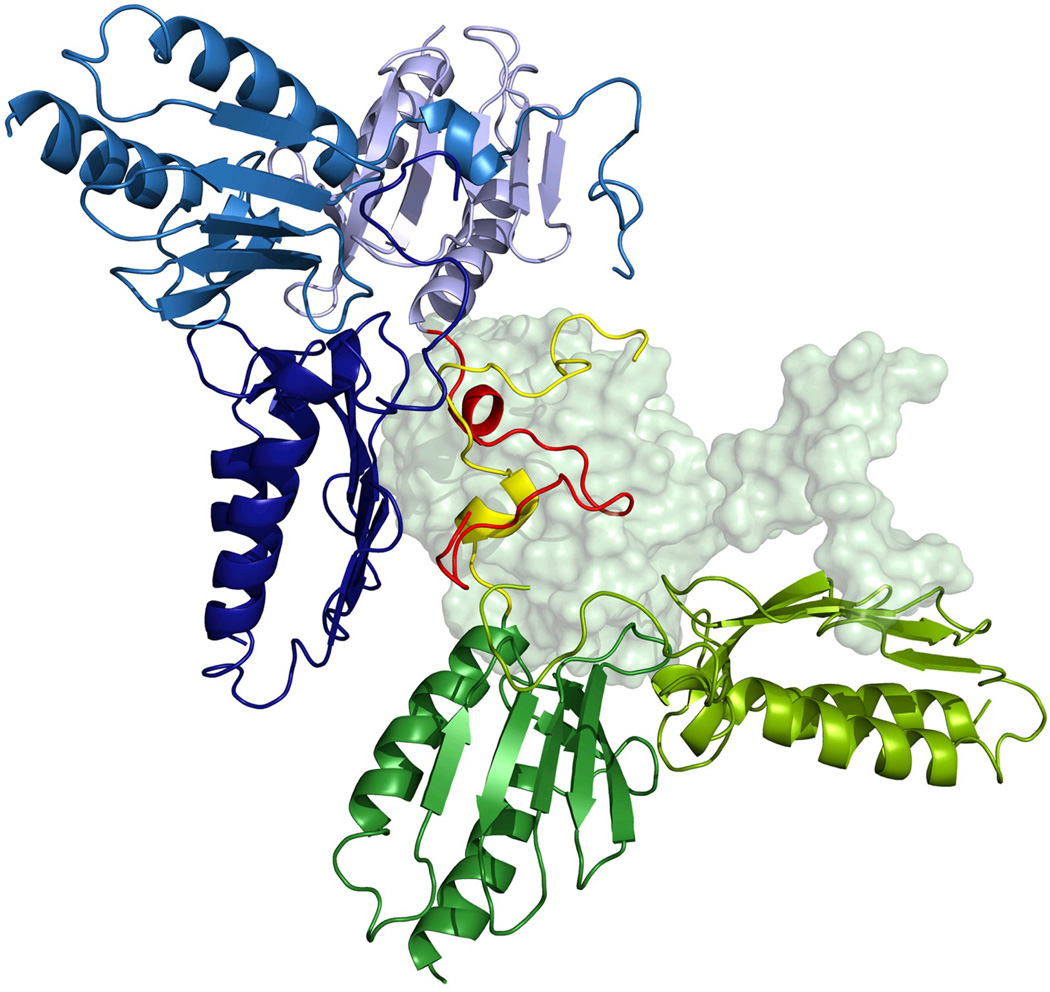
Figure 3.
The X-ray structure of the Y73A frataxin variant. (a) The interaction of the N-terminal region of one of the subunits with the neighboring subunit. Amino acid side chains are shown as sticks and a possible hydrogen bond between E64-E112 as a dashed line. (b) The intersection of the N-termini of two monomers belonging to two different trimers within the crystal lattice. (c) Packing of Y73A frataxin trimers, with each trimer colored uniquely. One of the monomers is shown in surface representation for clarity. The N-terminal residues 52–60 are colored orange and brown. (d) Packing of the Y73A variant into hexamers, as suggested by the models of the hexamers used to fit the SAXS scattering data. (see Methods section).


