
Figure 1.
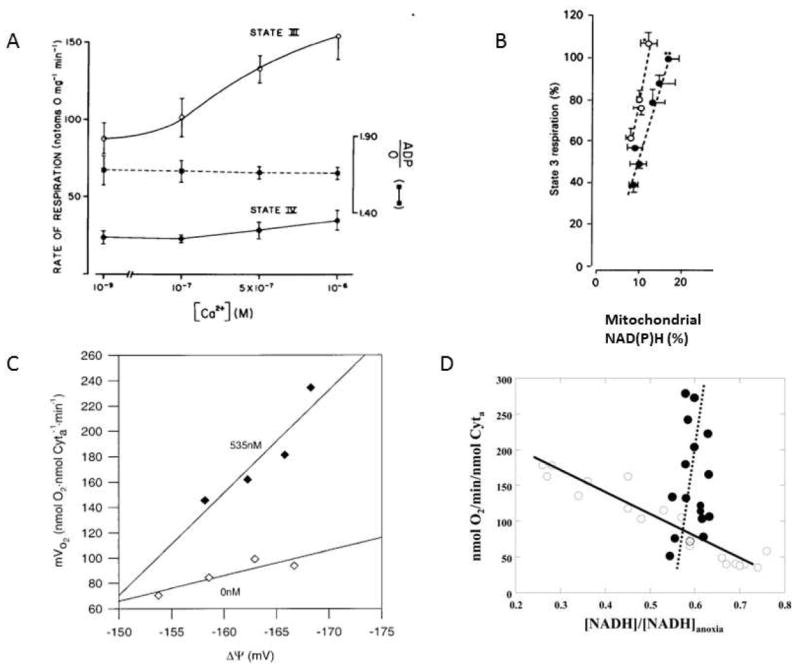
A) Effect of extra-mitochondrial Ca2+ on the rate of respiration in isolated rat liver mitochondria respiring on 5 mM succinate. A 5 minute pre-incubation with Ca2+ was used before driving State 3 respiration with 250 μM ADP(74). Reproduced with permission. B) Effect of extramitochondrial Ca2+ on the relationship between [NAD(P)H] and respiration in isolated liver mitochondria. All experiments were conducted with 5 mM malate. Solid points represent the control study with effectively no Ca2+ and mitochondrial [NAD(P)] increased with increasing glutamate (0.25, 0.5, 1, 2, 5 and 10 mM). The open circles are with fixed substrates 1 mM glutamate and 5 mM malate with the extramitochondrial Ca2+ varied from 5 nM (initial value), 66, 130, 225 and 400 nM (adapted from(83) reproduced with permission) C) Mitochondrial membrane potential versus oxygen consumption of State-3 respiration with variable substrates in the presence and absence of Ca2+in porcine heart mitochondria. In all experiments only the glutamate /malate total concentration was varied from 0.5-5.0 mM to generate a difference in driving force from the citric acid cycle. The open symbols are in the nominal absence of Ca2+. The filled symbols are in the presence of the previously determined optimal Ca2+ concentration of 535 nM. Data from (87), reproduced with permission. D) Relationship between [NADH] and oxygen consumption with apyrase or a sarcoplasmic reticulum(SR)-mitochondria reconstitution system Open symbols are data collected by varying [Apyrase]. Increasing [Apyrase] increased respiration but decreased [NADH]. Closed Signals are fixed [SR] and [mitochondria] (ratio of SR to mitochondria 0.5) with varying [Ca2+] over low physiological levels of 0 to 492 nM (calculated free concentration). Increasing [Ca2+] increased respiration over 5 fold with a slight increase in [NADH]. Lines are the linear regression of the data points. Data from (92), reproduced with permission.