
Figure 2.
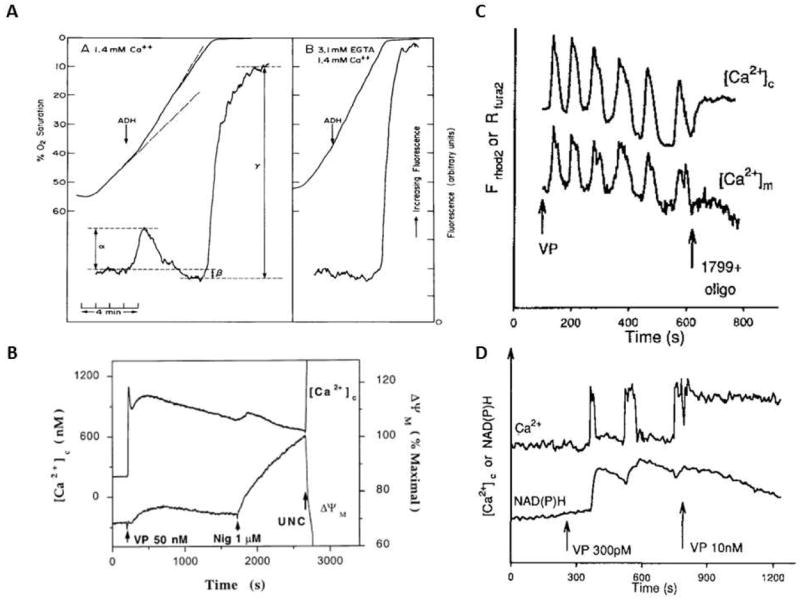
A) Effect of ADH on NADH and oxygen consumption of isolated rat hepatocytes. In both panels 100 nM ADH was added to the chambers at the arrow in the absence (A) and presence (B) of 3.1 mM EGTA. Data from (110), reproduced with permission. B) Measurements of Ca2+c and ΔΨ in cultured hepatocytes with vasopressin (50 nM). [Ca2+]c was measured using fura-2 and ΔΨ was monitored with TMREE. Data from (111), reproduced with permission. C) Temporal correlation of Ca2+c and Ca2+m during hormonal stimulation of hepatocytes. [Ca2+]m was monitored in hepatocytes loaded with dihydro-Rhod 2-AM, and [Ca2+]c was measured in cells loaded with Fura 2-AM. Data from (114), reproduced with permission. D) 4. Relationship between the frequency of Ca2+c and NAD(P)Hm fluorescence. NAD(P)H and [Ca2+]c were measured simultaneously during the addition of vasopressin (VP). Data from (114), reproduced with permission