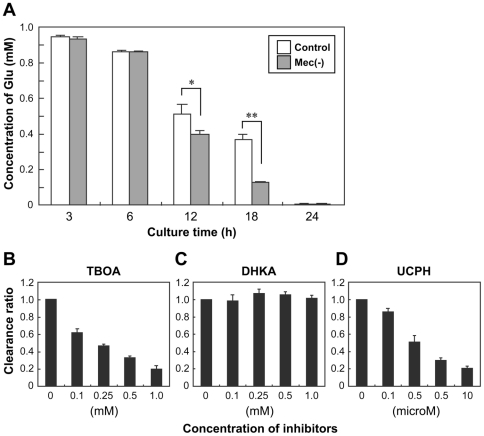
Figure 4. Comparison of glutamate clearance in wild-type and MeCP2-null astrocytes.
A. Time-dependent reduction of extracelluar Glu concentration in wild-type (white column) and MeCP2-null (gray column) astrocyte cultures. After treatment with 1.0 mM Glu, culture supernatant was collected at the indicated times for the determination of Glu concentration. The graph shows the concentration of Glu in control and MeCP2-null astrocyte culture medium. Bars represent the means ± SE of samples from three independent experiments (*p<0.05). B–D. Effects of inhibitors of glutamate transporters (B, TBOA; C, DHKA; D, UCPH) on Glu clearance. Astrocytes were exposed to the indicated concentration of Glu transporter inhibitors, and then 0.1 mM Glu was added; culture supernatant was collected for the determination of Glu concentration at 2 h. The graphs show the clearance ratio upon treatment with each inhibitor. The clearance ratio in the indicated concentration groups was expressed by defining the control level (no inhibitor) as 1.0. Bars represent the means ± SE of samples from three independent experiments.

