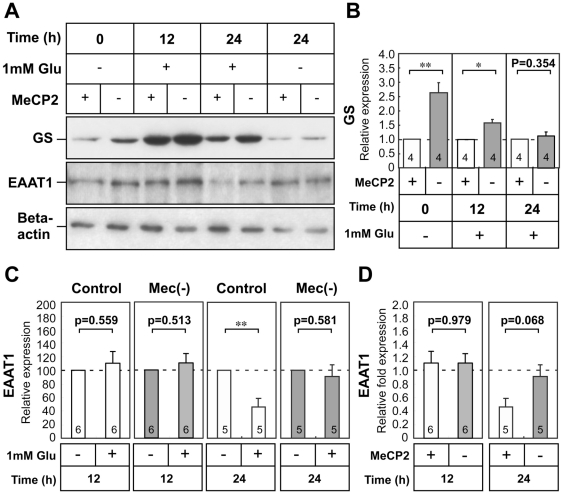
Figure 5. Effect of glutamate on glutamine synthetase and EAAT1 protein expression in MeCP2-null astrocytes.
A. Time-dependent expression of GS and EAAT1 proteins in wild-type and MeCP2-deficient astrocyte cultures. Astrocytes were treated with 1.0 mM Glu for 24 h, and subsequently analyzed for expression of GS and EAAT1 by Western blot analysis. Beta-actin protein levels were analyzed in the same way, as an internal control. B. The immunoreactive GS protein bands were quantified by densitometry, normalized against β-actin levels, and expressed as fold change relative to the controls (equals 1.0). Bars represent the means ± SE of samples from three independent experiments (*p<0.05, **p<0.01). Numbers in each column indicate the total number of samples analyzed. C. The immunoreactive EAAT1 protein bands were quantified by densitometry, normalized against β-actin levels, and expressed as % of controls (equals 100%). Bars represent the means ± SE of samples from three independent experiments (**p<0.01). D. Comparison of the effects of Glu on EAAT1 expression in wild-type and MeCP2-null astrocytes. The ratio of EAAT1/β-actin in each treatment group was normalized against that of the non-treated astrocytes from each group. Bars represent the means ± SE of samples from three independent experiments. Numbers in each column indicate the total number of samples analyzed.

