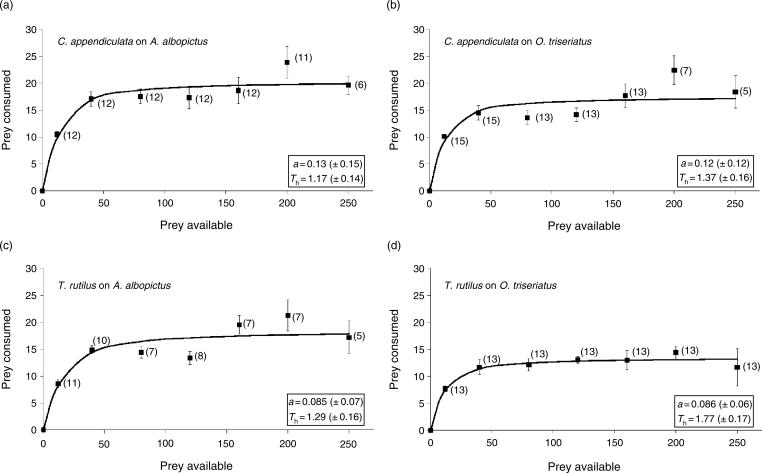
Fig. 1.
Functional response of (a) Corethrella appendiculata to Aedes albopictus, (b) C. appendiculata to Ochlerotatus triseriatus, (c) Toxorhynchites rutilus to A. albopictus, and (d) T. rutilus to O. triseriatus. Each point represents the mean number of prey consumed over a 24-h period, with one SE above and below each point. a and Th are the estimated attack rates and handling times, respectively (±95% CI). The solid line is predicted from the random predator model. Number of replicates are indicated in parentheses.

