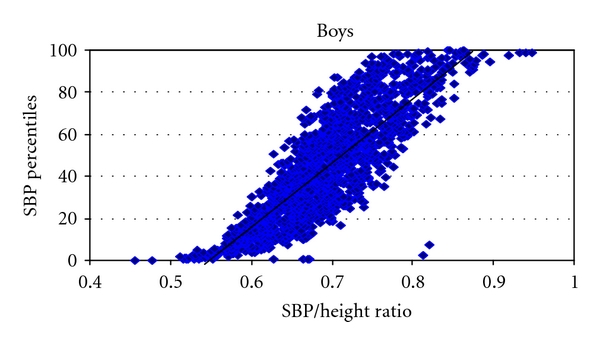
Figure 1.

The graph depicts the strong correlation of systolic blood pressure percentiles (SBP Percentiles), on the Y Axis and the systolic blood pressure over height ratio (SBP/height ratio) on the X Axis in boys P < 0.001, R 2 = 0.85, SBP: systolic blood pressure.
