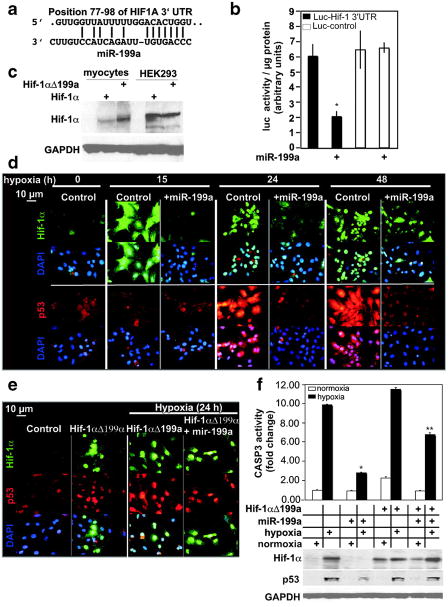
Figure 2.
MiR-199a targets and inhibits Hif-1α. a, The alignment between Mus musculus miR-199a and the 3′UTR of HIF1A, identified by TargetscanS software. b, The miR-199a target region, or a mutant, was cloned into the 3′UTR of a luciferase gene (represented in the graph by black and white bars, respectively). These constructs were introduced into myocytes, in addition to exogenous miR-199a (where marked by +) or a control virus (n = 6). After 24 hours, luciferase activity was measured, averaged, and plotted. The y axis represents arbitrary luciferase activity normalized to micrograms of protein content. Error bars represent SEM. *P<0.01, miR-199a–treated luciferase-Hif-1α 3′UTR target vs control. c, Wild-type Hif-1αcDNA or a mutant lacking miR-199a target site (Hif-1αΔ199a) were delivered to cardiac myocytes or HEK293 cells. After 24 hours, protein was extracted and analyzed by Western blotting (n = 2). d, Myocytes were treated with a control or a miR-199a overexpressing virus for 24 hours before subjecting them to various periods of hypoxia, as indicated. Parallel slides were stained separately with anti–Hif-1α (green) or anti-p53 (red) antibodies and DAPI (blue) (n = 4). e, Myocytes were treated with a control or Hif-1αΔ199a virus, in the absence or presence of a control or miR-199a virus for 24 hours. Cells were then exposed to hypoxia for 24 hours where indicated, before immunostaining with anti-Hif-1α (green), anti-p53 (red), and DAPI (blue) (n = 3). f, Myocytes were treated as in e. Protein was extracted and either assayed for caspase 3 activity (graph, n = 6) or analyzed by Western blotting (n = 3). The treatments are indicated in the grid below the graph by + signs and each aligned with its Western blot results. Results were averaged, normalized to protein content, and plotted as fold change after adjusting basal levels to 1. Error bars represent SEM, *P<0.001, miR-199a–treated vs untreated cells during hypoxia; **P<0.01, miR-199a–treated plus Hif-1aΔ199a vs miR-199a–treated.

