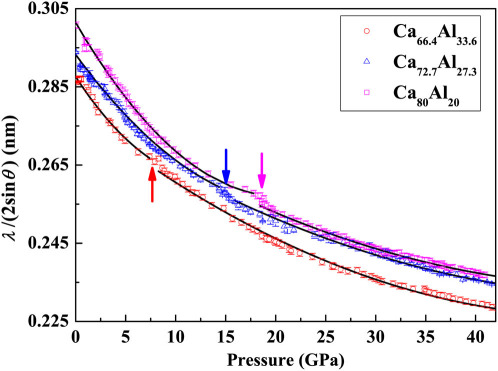
Figure 2. The parameter,  , of the main amorphous peak, which is related to the reduced volume of the sample V(P)/V(0), as a function of pressure for Ca100−xAlx (x = 20, 27.3, and 33.6 at.%) MGs.
Transitions are marked by arrows. Error bars for experimental data are given and some are smaller than the symbol size. The solid lines are guides to the eye.

