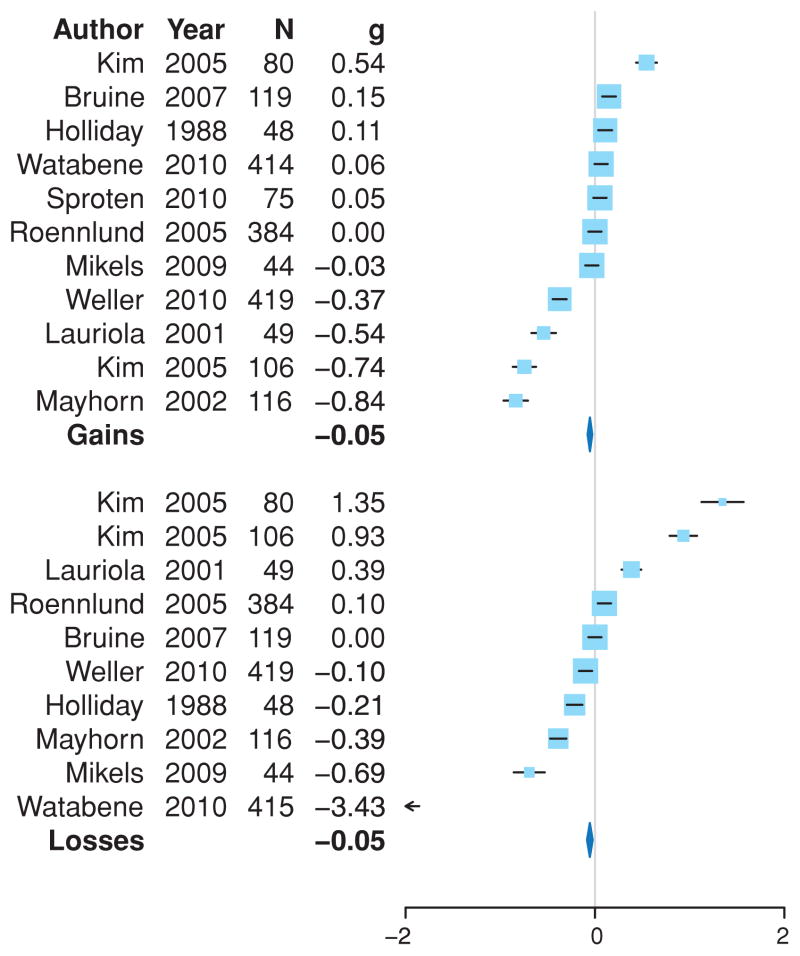
Figure 3.
Decisions from description: gains vs. losses. Forest plot for studies using decisions from description and that distinguish between gain and loss domains. The positions of the squares on the x-axis indicate the effect size for each study; the bars indicate the 95% confidence intervals of the effect sizes, and the sizes of the squares are inversely proportional to the respective standard errors (i.e., larger squares indicate smaller standard errors).

