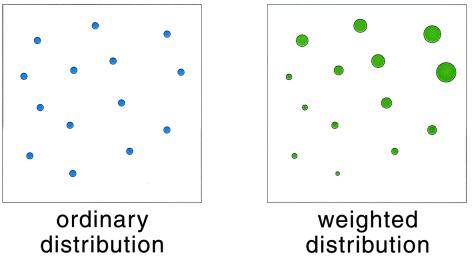
Figure 2.
A schematic representation of the ordinary and weighted distributions of molecule configurations. (Left) A simple snapshot of the ensemble at a given moment in time, for instance when the handle reaches the position λB; each circle represents the current configuration of a specific realization. (Right) Each realization is additionally assigned a statistical weight, depicted by the size of the size of the circle.

