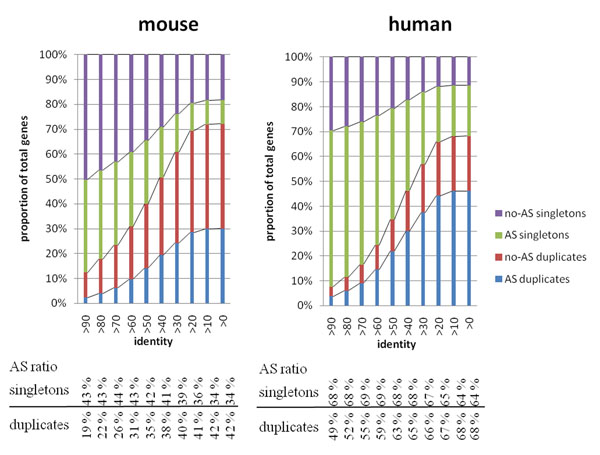
Figure 1.
Distribution of singletons and duplicated genes with and/or without AS. This figure shows the distribution of singleton and duplicates across different criteria of percent identity. The ratios of singletons (or duplicates) having AS under each criterion are also listed at the lower panel of the figure. For those high identity criteria groups, only recently duplicated genes are considered as duplicates, while for those lower identity criteria, both new and anciently duplicated genes are grouped as duplicates. As the percent identity threshold for a duplicated gene becomes lower, the proportion of duplicated genes (summation of red and blue) grows. The proportion of duplicated genes having alternative splicing also grows, and the growth rate is actually faster than the growth rate of duplicated genes. As a result, the proportion of genes having AS among duplicates is statistically significantly greater than the proportion of AS among singletons at lower identity criteria (identity >20 for both human and mouse). That is, those ancient duplicated genes have more alternative splice isoforms than singletons.

