
Figure 3.
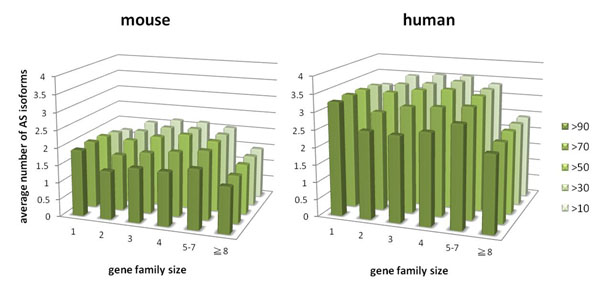
Average number of AS isoforms. Average number of AS isoforms for singleton and duplicated genes across different identity criteria. For gene duplicates identified by >90 identity criterion (bars with darkest green) there is a decrease in the number of average AS isoforms compared to the number of average AS isoforms of singleton genes in both human and mouse. On the other hand, for those gene families identified by >30 or >10 identity criteria, the number of average AS isoforms in smaller gene families (≦7) is larger than singletons, which in turn is still larger than the average number in the big gene families (≧8).