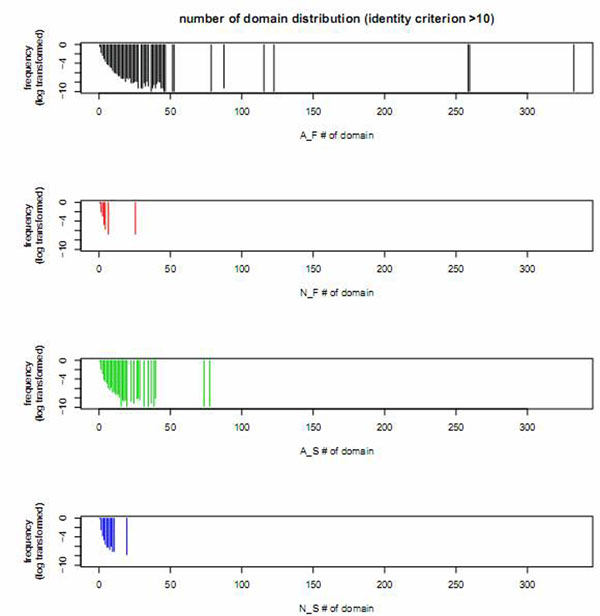
Figure 5.
Number of domain(s). Domain number distribution for genes of four groups of genes: A_F, N_F, A_S, and N_S (for AS gene families genes, no AS gene families genes, AS singletons, no AS singletons, respectively) identified with identity criterion >10. The y axis is a log transformed frequency among each group. The lower the frequency, the longer the line is on the plot, and the higher the frequency the shorter the line is. There are sparse lines for domain number larger than 50. For both gene families and singletons the no AS genes have less number of domain(s) compared to AS genes. Overall, N_F have the least number of domains.

