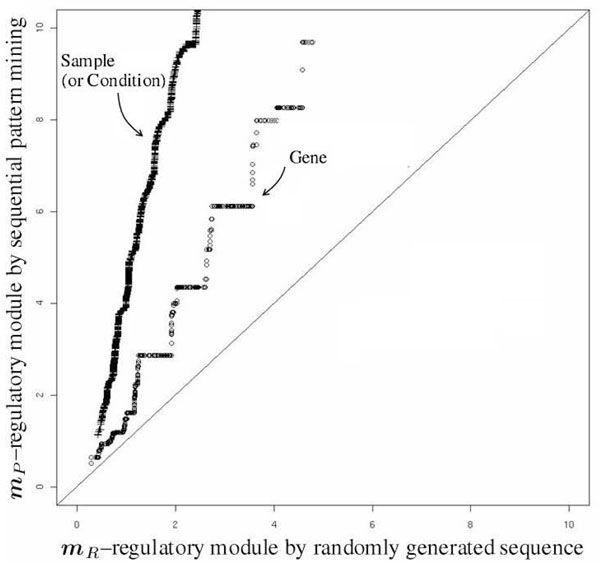
Figure 2.
Quantile-quantile plot. Quantile-quantile plot: The pairs of p-values corresponding to the pairs of (mP, mR) on the same quantile are scattered onto the axes of negative log-scale. The circle stands for the p–values of gene annotation, whereas the cross stands for the p–values of sample annotation.

