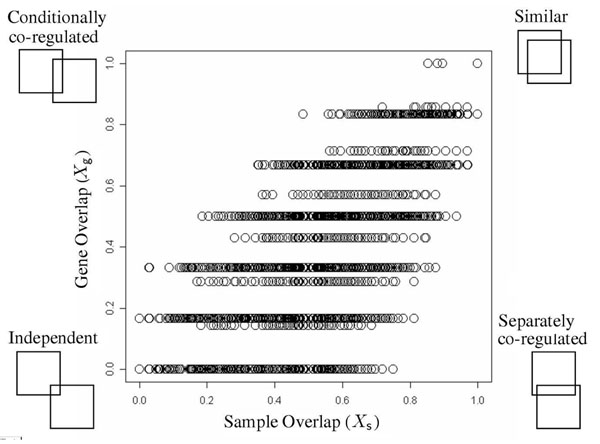
Figure 3.
Inter-modular relation by gene- vs. sample- overlap. Inter-modular relation by gene- vs. sample- overlap: All possible pairs of 300 representative RMs, 300C2 pairs, are scattered onto the panel of Xg–axis and Xs–axis. A circle represents (Xs, Xg) of a pair (m, m′). The cartoons at the corners represent the four types of inter-module relations; the disposition of two boxes illustrates how two modules are relatively located in the gene expression matrix, where a box symbolizes a module m with the rows of genes and the columns of samples.

