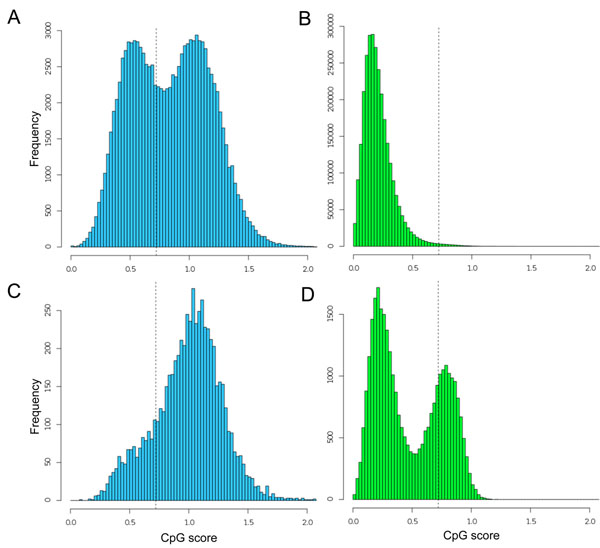
Figure 2.
Distributions of the CpG score frequencies in 1-kb genomic fragments and promoters. The histograms show the distributions in the ascidian genome (A), the human genome (B), ascidian promoters (C), and the promoters of human protein-coding genes (D). Vertical dotted lines indicate a CpG score of 0.721, around which human CpG island promoters are dispersed [5]. The distributions of the overall genome scores differ between human and ascidian (unimodal vs. bimodal, respectively), but the distributions of the promoter scores of the human and ascidian sequences differ obversely (bimodal vs. unimodal, respectively).

