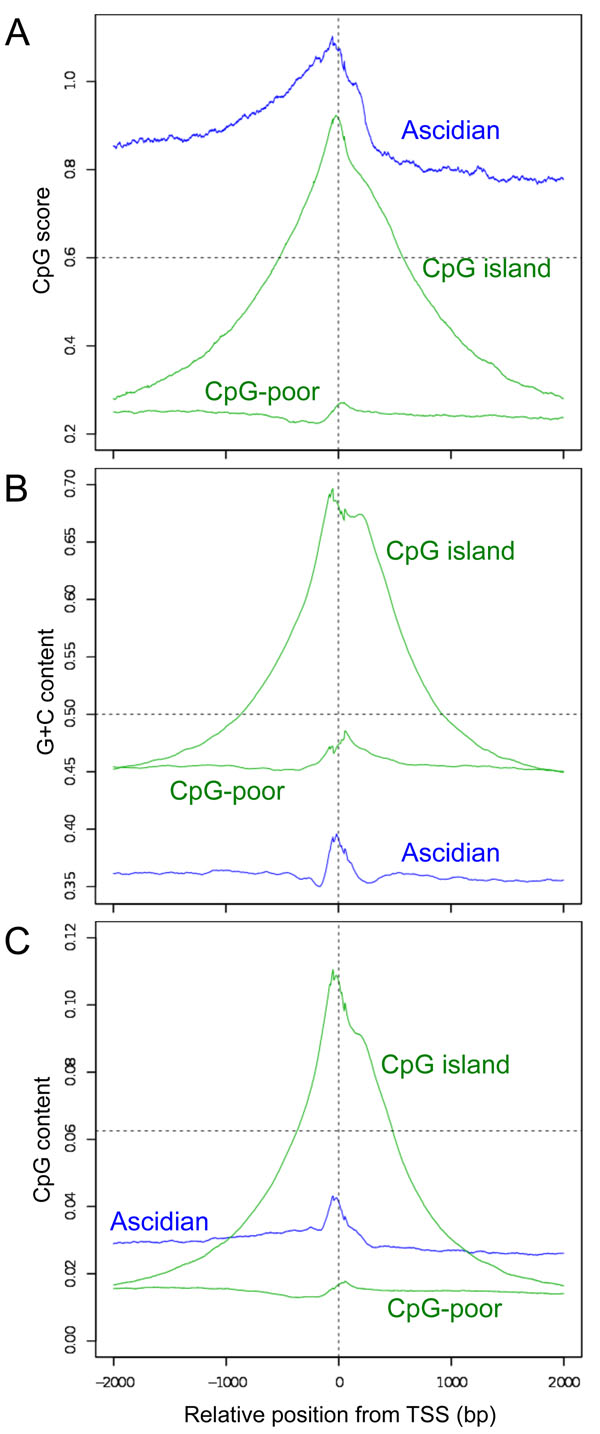
Figure 3.
Changes in the CpG scores (A), G+C contents (B), and CpG contents around the TSS. The local CpG score, G+C content, and CpG content at each position within a 4-kb region, with a moving window size of 100 bp, were averaged for the ascidian, human CpG-poor, and CpG island promoters. The horizontal axes indicate the position relative to the representative TSS. Horizontal dotted lines indicate the conventional criteria for vertebrate CpG islands (A, B) and the expected content of each dinucleotide, 1/16 (C).

