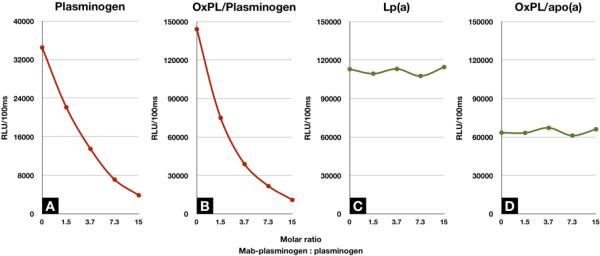
Figure 3.
Assessment of the presence of OxPL on plasminogen using immunoprecipitation. This figure displays a representative example of the immunoprecipitation of plasminogen from plasma in a healthy individual with the addition of increasing amounts of anti-plasminogen antibody. The X-axis shows the molar ratio of antibody to plasminogen content added. A: Plasminogen levels remaining in the supernatant following immunoprecipitation. B: OxPL/plasminogen in the supernatant. C: Lp(a) level in supernatant. D: OxPL/apo(a) levels in supernatant.

