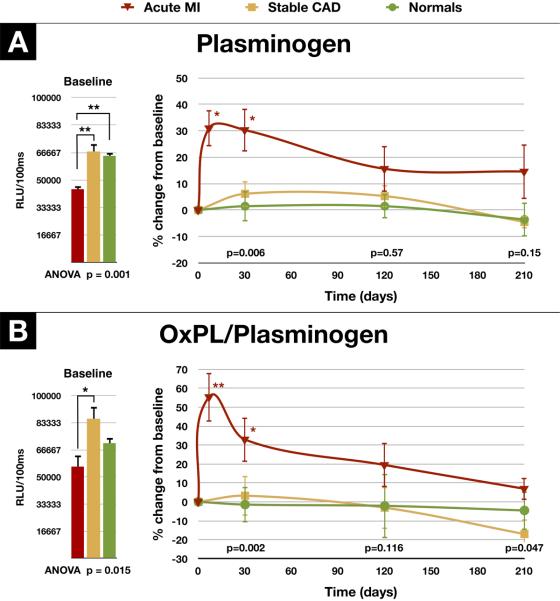
Figure 8.
Change in plasminogen and OxPL/plasminogen in normal subjects, patients with stable coronary artery disease and acute myocardial infarction. Panel A shows the baseline levels and changes in plasminogen levels over a 7 month period in patients following AMI (n=8), in patients with stable CAD (n=17) and in healthy subjects (n=18). Panel B shows the baseline levels and changes in OxPL/plasminogen over the same time period. The p-values at the bottom of the figures represent the discharge (average of 4 days for the AMI group) and 30, 120, and 210-day differences between groups at each time point. *p<0.05 and **p<0.01 represent Bonferroni post test for changes within groups over time.

