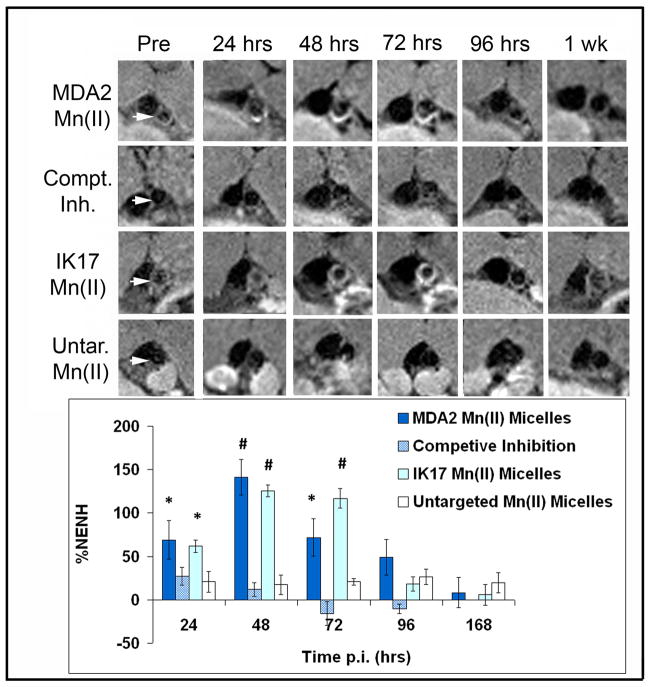
Figure 5.
Representative MR images obtained in the abdominal aorta (white arrows) of apoE−/− mice following injection of Mn micelles (0.05 mmol Mn/Kg). The percent normalized enhancement values (%NENH) represents the relative change in the contrast-to-noise ratios pre and post imaging. For the competitive inhibition studies, 3 mg of free MDA2 antibody was co-injected with the MDA2 labeled Mn micelles. used to compare the 4 types of micelles. *=p<0.05, #=p<0.01 represents Kruskal–Wallis tests for differences between groups compared to the untargeted Mn micelles.

