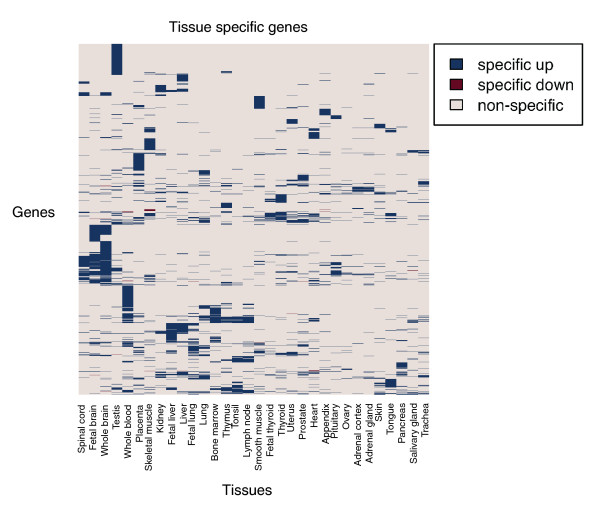
Figure 4.
Heatmap representation of the tissue specificity of each gene. The specific behavior of every specific gene (y-axis) in every tissue (x-axis) is represented by a colored box: blue if the gene is specifically up-regulated in the tissue, red if the gene is specifically down-regulated in the tissue, and light grey if the gene does not present any specific expression for the tissue.

