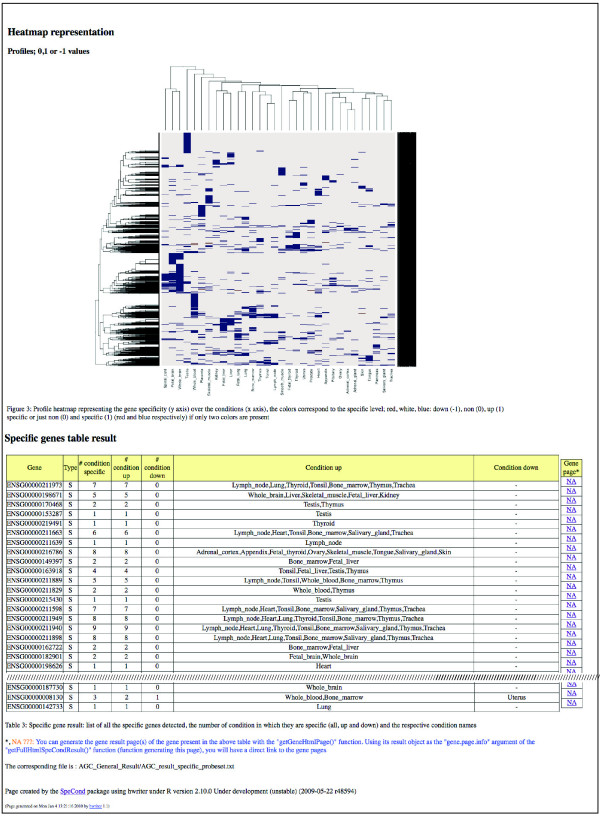
Figure 6.
SpeCond general HTML output (part 2). Following the tables and figures presented in Figure 5, the SpeCond general HTML page presents a heatmap of the tissue-specific genes (third figure) followed by a table containing all the tissue-specific genes with the numbers and tissues in which they are detected (up and down are separated). Links to an individual SpeCond specific HTML page, such as shown in Figure 7, are present in the rightmost column of the table if the pages have been previously generated by the user.

