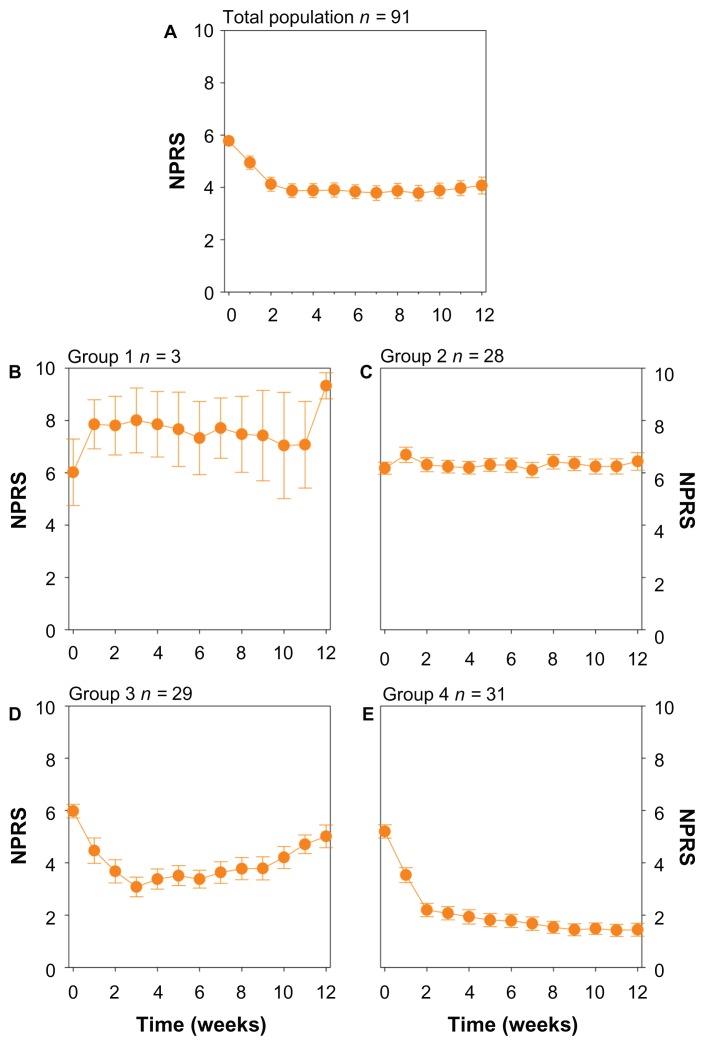
Figure 1.
(A) Mean response of the total population (n = 91). (B) Mean response of patients belonging to group 1 (patients with a deterioration of their pain) as determined from the mixture model analysis. (C) Mean response of patients belonging to group 2 (patients with no response to treatment). (D) Mean response of patients belonging to group 3 (patients with an initial drop in NPRS followed by a slow decline towards baseline NPRS). (E) Mean response of patients belonging to group 4 (patients with a reduction in NRPS which is maintained throughout the study period). Values are mean ± SEM.
Abbreviations: NPRS, numerical pain rating score; SEM, standard error of the mean.

