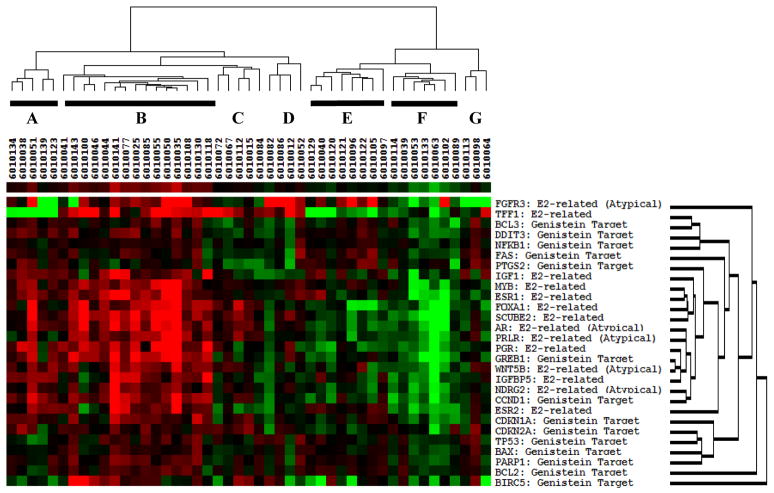
Figure 2.
Heatmap of gene expression by Taqman low density array in soy-treated women; clustering by gene group (Month 6 – Baseline Differences adjusted by housekeeping genes). Clustering is based on grouping ‘similar’ genes together, where ‘similarity’ here is in turn based on the degree of correlation of expressions levels among genes and among treatment groups. Pearson correlations were used to determine clustering.

