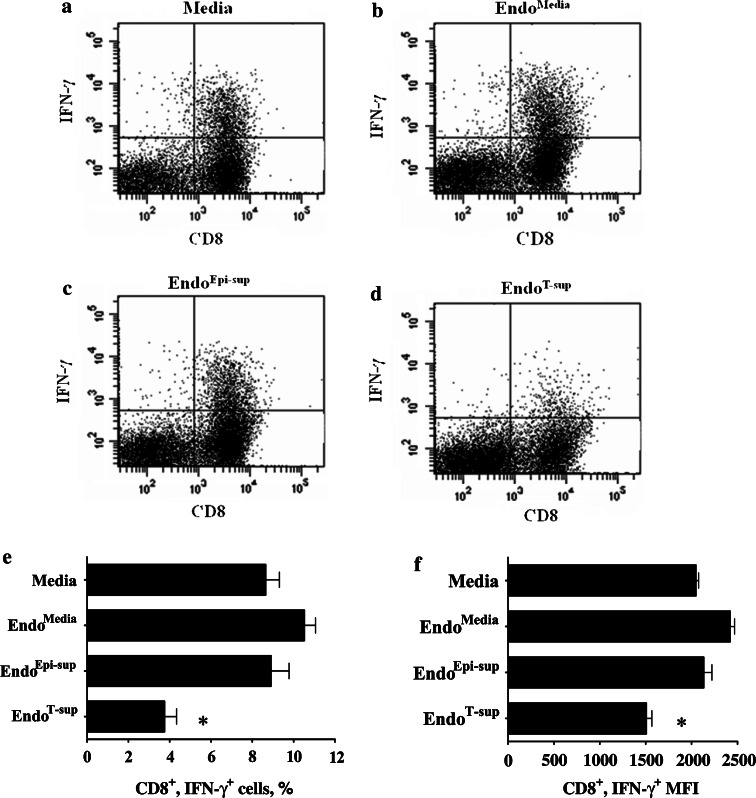
Fig. 7.
CD8+ T-cell responses to anti-CD3 stimulation in the presence of conditioned media from endothelial cells: CD8+ T-cell activation was assessed by flow cytometric determination of intracellular IFN-γ staining. a–d Representative data of T-cells that were immunostained for CD8 and IFN-γ. e Mean percent of CD8+/IFN-γ+ ± SEM with n ≥ 4 for all treatments groups. f Mean fluorescent intensity (MFI) of flow cytometric staining for IFN-γ by CD8+ T-cell ±SEM with n ≥ 4 for all treatments groups. * indicates P < 0.0001 compared to each control group

