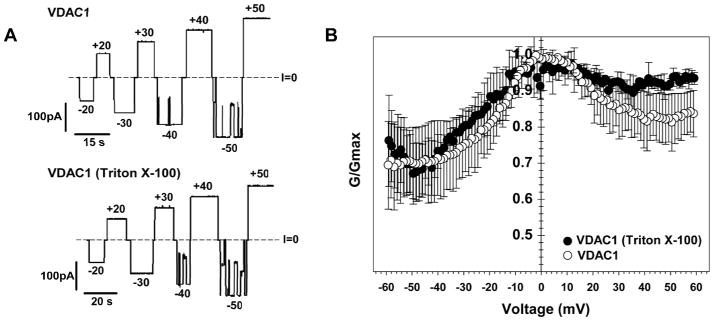
Figure 1.
(A) Representative single channel current traces of VDAC1 reconstituted into planar lipid membranes from 2D crystals without (top) or with (bottom) the presence of Triton X-100 in the sample buffer used for functional studies. Applied voltages are shown. Dashed lines indicate zero current levels. (B) Characteristic bell-shape plots of the normalized average conductance vs. applied voltage. Each data point is a mean of three experiments ±STD.

