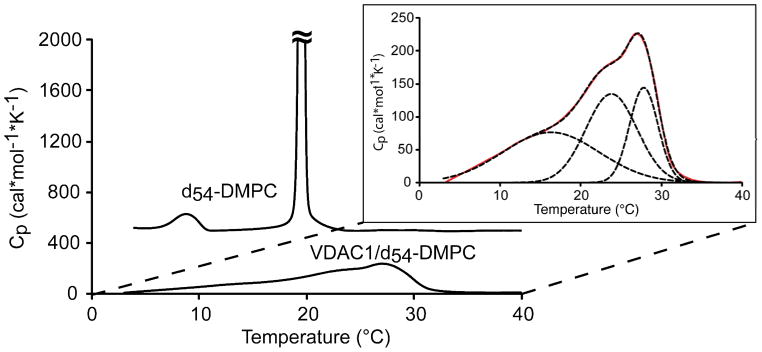
Figure 2.
DSC thermograms of pure d54-DMPC and VDAC1/d54-DMPC 2D crystal. The largest peak at 19 °C for pure DMPC is cutoff in this figure so that the 2D crystals can be visualized on the same scale. Inset: Expansion of the DSC thermogram of VDAC1/d54-DMPC 2D crystals and simulations using two narrow and one broad component. Experimental data are graphed by the solid red line, and the simulated values are shown by the black dashed lines.

